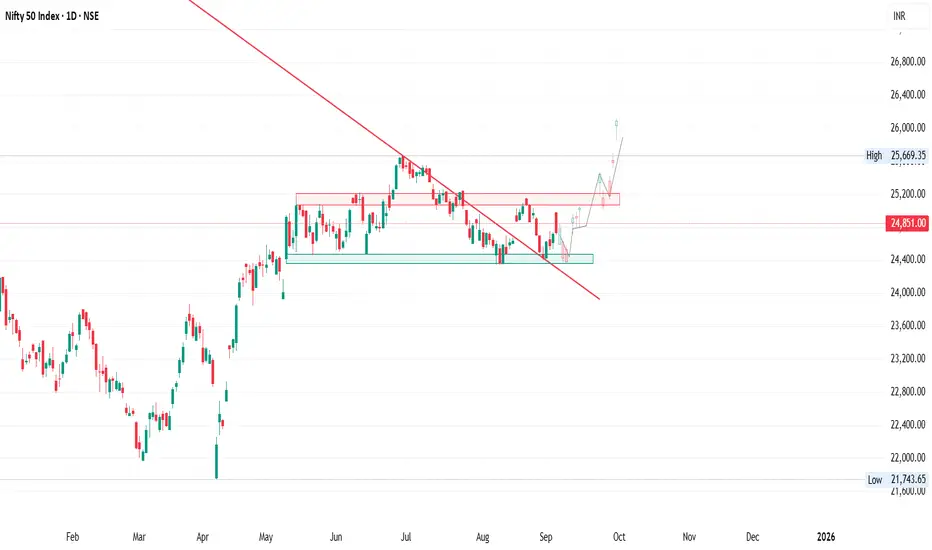
Nifty has already broken out of a downward sloping trendline (marked in red).
Breakout was supported by price bouncing twice from the demand zone
Support Zone:
Strong base identified around 24500(Green box).
This zone has repeatedly acted as demand, preventing deeper correction.
Resistance Zones:
Overhead resistance at 25000–250100 (Red box).
Sustained move above this zone can confirm bullish continuation.
Price Structure:
After breakout, price is retesting its old support.
If this retest holds, Nifty may resume its upward path toward higher targets.
Disclaimer: This is an educational analysis based on price action on the daily chart. Not financial advice. Always use risk management and confirm with your own trading plan.
면책사항
이 정보와 게시물은 TradingView에서 제공하거나 보증하는 금융, 투자, 거래 또는 기타 유형의 조언이나 권고 사항을 의미하거나 구성하지 않습니다. 자세한 내용은 이용 약관을 참고하세요.
면책사항
이 정보와 게시물은 TradingView에서 제공하거나 보증하는 금융, 투자, 거래 또는 기타 유형의 조언이나 권고 사항을 의미하거나 구성하지 않습니다. 자세한 내용은 이용 약관을 참고하세요.