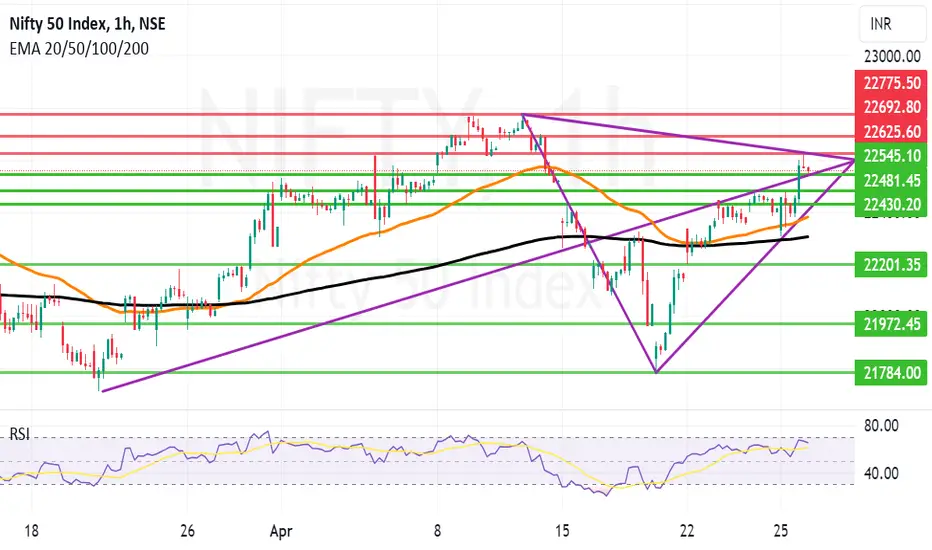
Arrow in the chart of Nifty is pointing in the direction of which Nifty intends to go in the long term. There may be some slip-ups in the short run but in the long run Nifty will be seen travelling in the direction the arrow is pointing.
Today Nifty returned from an important trendline resistance of 22625. crossing the same will be a little bit of a challenge. If we get a weekly closing above 22625 Nifty can quickly make new highs in the coming days with resistance at 22692 and 22775.
In case the mid arrow support is broken tomorrow we may see a down side with supports at 22545, 22481, 22430, 22380 and 22304. Below 22304 Nifty becomes weak again and bears can start calling the shots.
Shadow of the candle is negative to neutral as of now.
면책사항
이 정보와 게시물은 TradingView에서 제공하거나 보증하는 금융, 투자, 거래 또는 기타 유형의 조언이나 권고 사항을 의미하거나 구성하지 않습니다. 자세한 내용은 이용 약관을 참고하세요.
면책사항
이 정보와 게시물은 TradingView에서 제공하거나 보증하는 금융, 투자, 거래 또는 기타 유형의 조언이나 권고 사항을 의미하거나 구성하지 않습니다. 자세한 내용은 이용 약관을 참고하세요.