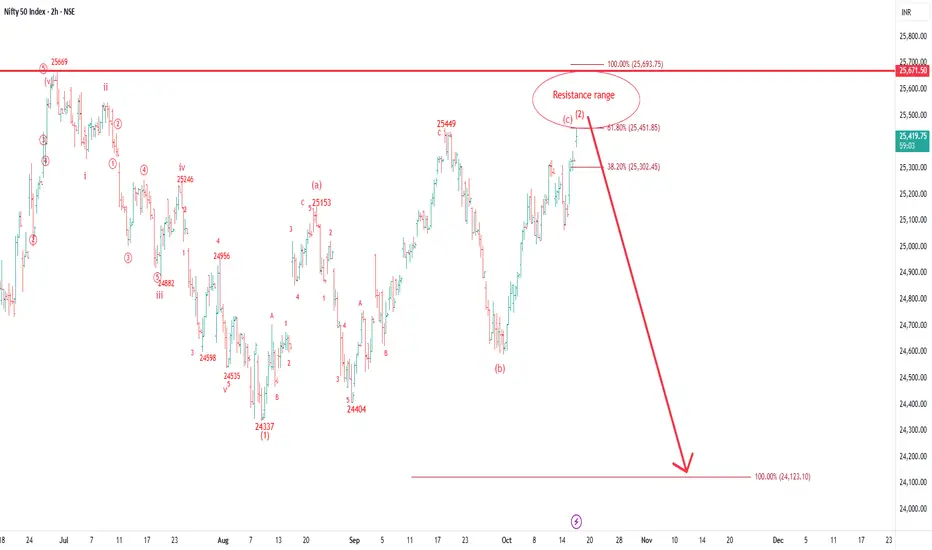
In this 2hour chart Nifty formed a corrective pattern from 24337 and now it is near to its completion range and soon may decline below 24300 in coming days/weeks.
This analysis is based on Elliott wave Theory so If you have not understand Elliott wave then kindly ignore it.
Thank you.
This analysis is based on Elliott wave Theory so If you have not understand Elliott wave then kindly ignore it.
Thank you.
면책사항
이 정보와 게시물은 TradingView에서 제공하거나 보증하는 금융, 투자, 거래 또는 기타 유형의 조언이나 권고 사항을 의미하거나 구성하지 않습니다. 자세한 내용은 이용 약관을 참고하세요.
면책사항
이 정보와 게시물은 TradingView에서 제공하거나 보증하는 금융, 투자, 거래 또는 기타 유형의 조언이나 권고 사항을 의미하거나 구성하지 않습니다. 자세한 내용은 이용 약관을 참고하세요.