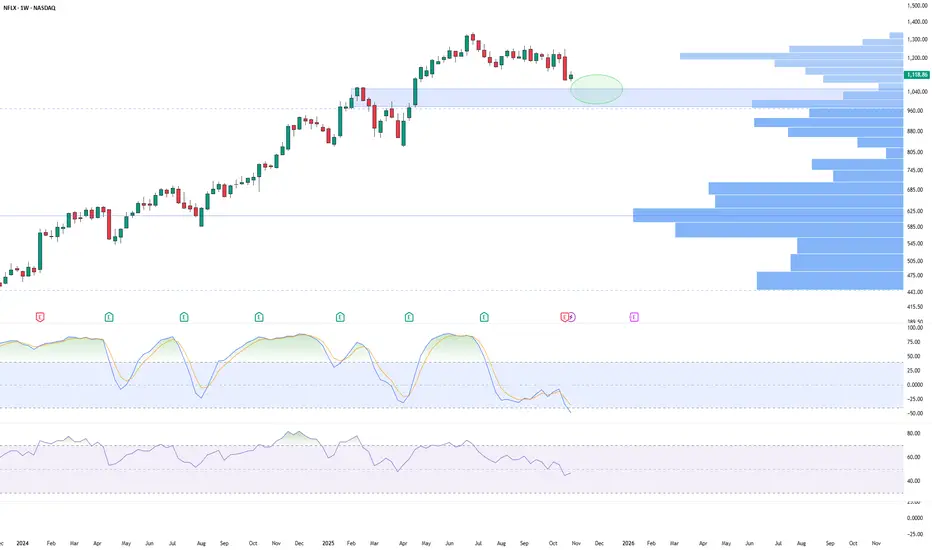
Netflix enters the shortlist this week.
A potential buy zone is approaching, with momentum indicators turning interesting.
My custom indicator The Wave is flashing a potential long setup, right around the $1,000 area, maybe slightly above.
Earnings are already behind us, which clears the way for clean price action.
The long-term uptrend that started in late 2023 remains intact.
Bullish structure still in place and a possible setup forming for patient swing traders.
Let’s see how this zone reacts in the coming weeks.
Mike
면책사항
해당 정보와 게시물은 금융, 투자, 트레이딩 또는 기타 유형의 조언이나 권장 사항으로 간주되지 않으며, 트레이딩뷰에서 제공하거나 보증하는 것이 아닙니다. 자세한 내용은 이용 약관을 참조하세요.
Mike
면책사항
해당 정보와 게시물은 금융, 투자, 트레이딩 또는 기타 유형의 조언이나 권장 사항으로 간주되지 않으며, 트레이딩뷰에서 제공하거나 보증하는 것이 아닙니다. 자세한 내용은 이용 약관을 참조하세요.