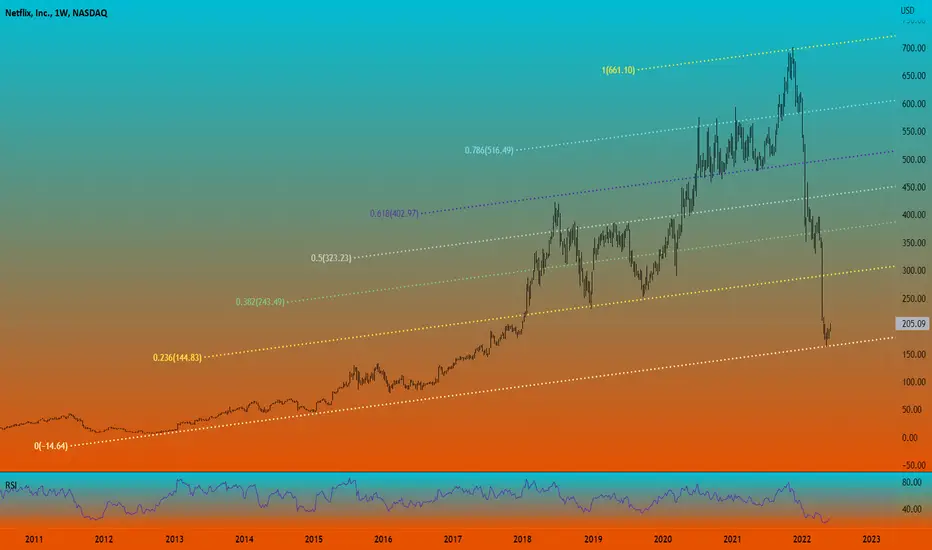
This is a weekly NFLX chart with the Fibonacci Channel applied to it dating back to the 2012 timeframe.
You could not have constructed this channel until the top was established so it wouldn't have done you much good on the front side of the move.
HOWEVER ... What this chart confirms to ME is the bottom is in.
WHY?
Look at the beautiful symmetry the chart displays at the respective Fibonacci levels. Remarkable isn't it?
That's enough confirmation to me this stock has seen it's low because one of the key points you need to use to construct the channel is the local low.
If this is not the low the past interaction with the Fibonacci levels would not line up as they do on this chart.
면책사항
해당 정보와 게시물은 금융, 투자, 트레이딩 또는 기타 유형의 조언이나 권장 사항으로 간주되지 않으며, 트레이딩뷰에서 제공하거나 보증하는 것이 아닙니다. 자세한 내용은 이용 약관을 참조하세요.
면책사항
해당 정보와 게시물은 금융, 투자, 트레이딩 또는 기타 유형의 조언이나 권장 사항으로 간주되지 않으며, 트레이딩뷰에서 제공하거나 보증하는 것이 아닙니다. 자세한 내용은 이용 약관을 참조하세요.