Technical Analysis Overview:
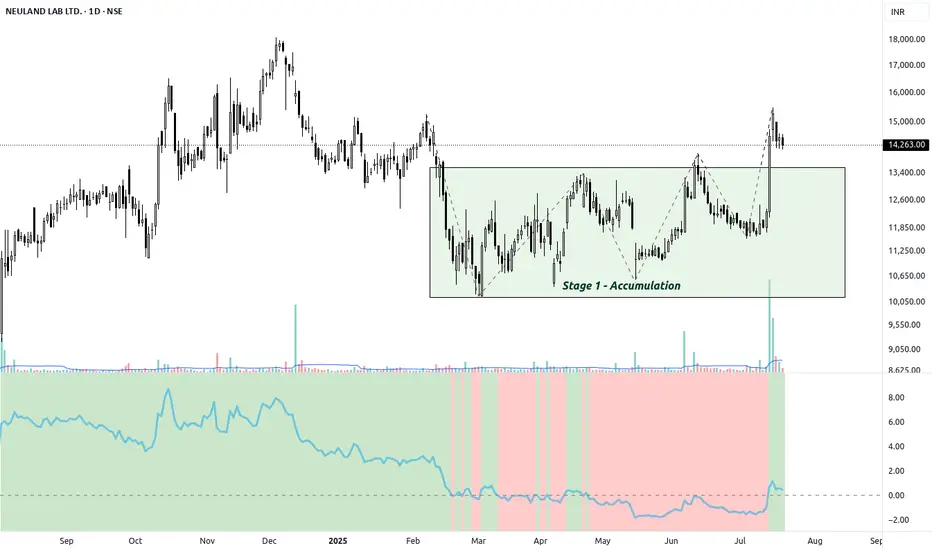
After a prolonged consolidation phase between ₹10,500 and ₹12,500, Neuland Labs has broken out with strong momentum and rising volume. The price has decisively moved above the 200 EMA , reclaiming a strong structure after a Change of Character and multiple Break of Structure confirmations.
🧩 Key Bullish Signals:
✅ Breakout from Accumulation Zone
After trading for a few weeks in the demand zone where accumulation took place.
The price respected this zone multiple times, forming higher lows before breaking out.
✅ Volume Surge
The breakout above ₹12,500 was accompanied by heavy volume, confirming institutional interest.
The retest near ₹13,600 has happened on lower volume, a bullish sign.
✅ All EMAs Aligned Bullishly
Short-term EMAs (blue/red) have crossed above the medium and long-term EMAs.
200 EMA is sloping up for the first time in months — classic sign of trend reversal.
✅ RS Indicator (at bottom of chart)
Relative strength has entered positive territory for the first time in a while, confirming outperformance versus the broader market.
📉 Risk Management:
Maintain disciplined SL at ₹12,800. If the stock fails to hold recent breakout levels, it may re-enter the consolidation zone.
🧠 Summary:
Neuland Labs is setting up for a trend continuation following a strong breakout from accumulation. Multiple confirmations from volume, price action structure (BOS/CHoCH), EMA alignment, and relative strength make this a high-probability swing trade candidate.
🔔 Disclaimer: This is not financial advice. Please do your own research and risk management before investing.
면책사항
해당 정보와 게시물은 금융, 투자, 트레이딩 또는 기타 유형의 조언이나 권장 사항으로 간주되지 않으며, 트레이딩뷰에서 제공하거나 보증하는 것이 아닙니다. 자세한 내용은 이용 약관을 참조하세요.
면책사항
해당 정보와 게시물은 금융, 투자, 트레이딩 또는 기타 유형의 조언이나 권장 사항으로 간주되지 않으며, 트레이딩뷰에서 제공하거나 보증하는 것이 아닙니다. 자세한 내용은 이용 약관을 참조하세요.