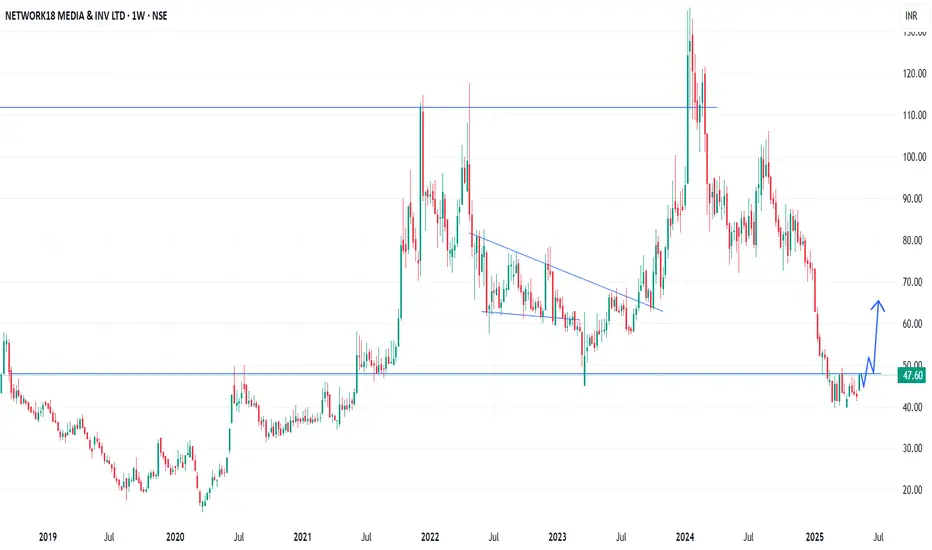
In the Weekly Chart of NETWORK18 ,
we can see that; it is trying to recover from very bottom with W Shape recovery.
Let it create one or two Halt candles to get more strong momentum.
Expected momentum is shown in chart.
we can see that; it is trying to recover from very bottom with W Shape recovery.
Let it create one or two Halt candles to get more strong momentum.
Expected momentum is shown in chart.
면책사항
해당 정보와 게시물은 금융, 투자, 트레이딩 또는 기타 유형의 조언이나 권장 사항으로 간주되지 않으며, 트레이딩뷰에서 제공하거나 보증하는 것이 아닙니다. 자세한 내용은 이용 약관을 참조하세요.
면책사항
해당 정보와 게시물은 금융, 투자, 트레이딩 또는 기타 유형의 조언이나 권장 사항으로 간주되지 않으며, 트레이딩뷰에서 제공하거나 보증하는 것이 아닙니다. 자세한 내용은 이용 약관을 참조하세요.