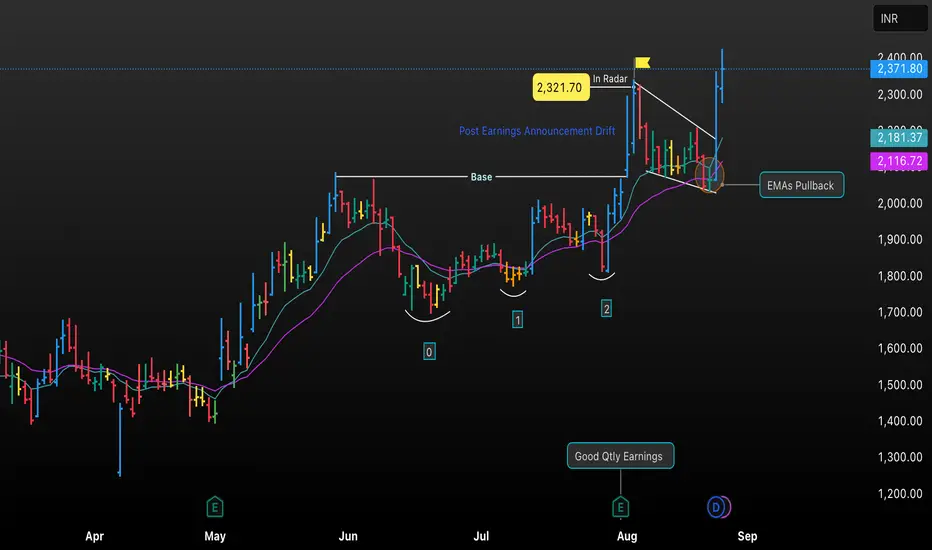
• This chart analyzes NETWEB’s price movement after a favorable quarterly earnings announcement, highlighting post-earnings drift, the formation of a trend base, and recent EMA pullback.
• Key annotations include buy signals, reaction levels, and actionable price zones to help identify optimal entry and exit opportunities for swing and positional trades.
• Clearly marked support and resistance, along with EMA overlays, provide a transparent ‘radar’ for traders to visualize how earnings and technical patterns interact.
면책사항
해당 정보와 게시물은 금융, 투자, 트레이딩 또는 기타 유형의 조언이나 권장 사항으로 간주되지 않으며, 트레이딩뷰에서 제공하거나 보증하는 것이 아닙니다. 자세한 내용은 이용 약관을 참조하세요.
면책사항
해당 정보와 게시물은 금융, 투자, 트레이딩 또는 기타 유형의 조언이나 권장 사항으로 간주되지 않으며, 트레이딩뷰에서 제공하거나 보증하는 것이 아닙니다. 자세한 내용은 이용 약관을 참조하세요.