📊 Current Snapshot
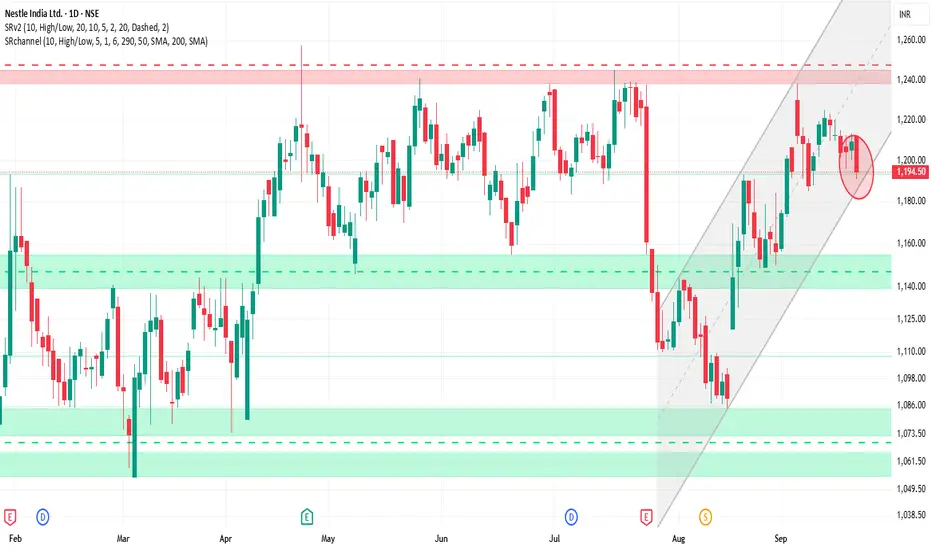
Closing Price: ₹1,194.50
Day’s Range: ₹1,190.20 – ₹1,212.00
52-Week Range: ₹1,055.00 – ₹1,389.00
Volume: Approximately 2.4 million shares traded
Market Cap: ₹2,30,337 Crores
P/E Ratio: 78.40 (reflecting premium valuation)
Dividend Yield: 2.26%
⚙️ Technical Indicators
Relative Strength Index (RSI): 47.51 – Neutral
Moving Average Convergence Divergence (MACD): -4.12 – Bearish
Moving Averages: Mixed signals; short-term averages above the current price, while long-term averages are below, indicating potential resistance.
Pivot Points: Central pivot around ₹1,194.73, suggesting a balanced market sentiment.
🎯 Potential Scenarios
Bullish Scenario: A breakout above ₹1,197.26 with strong volume could target ₹1,202.16 and higher levels.
Bearish Scenario: Failure to hold above ₹1,187.46 may lead to a decline toward ₹1,183.83.
⚠️ Key Considerations
Market Sentiment: Nestlé India has shown strong performance recently, but broader market conditions can impact its movement.
Volume Analysis: Watch for volume spikes to confirm breakout or breakdown signals.
Technical Indicators: While the RSI indicates a neutral stance, the MACD and moving averages suggest caution.
관련 발행물
면책사항
해당 정보와 게시물은 금융, 투자, 트레이딩 또는 기타 유형의 조언이나 권장 사항으로 간주되지 않으며, 트레이딩뷰에서 제공하거나 보증하는 것이 아닙니다. 자세한 내용은 이용 약관을 참조하세요.
관련 발행물
면책사항
해당 정보와 게시물은 금융, 투자, 트레이딩 또는 기타 유형의 조언이나 권장 사항으로 간주되지 않으며, 트레이딩뷰에서 제공하거나 보증하는 것이 아닙니다. 자세한 내용은 이용 약관을 참조하세요.