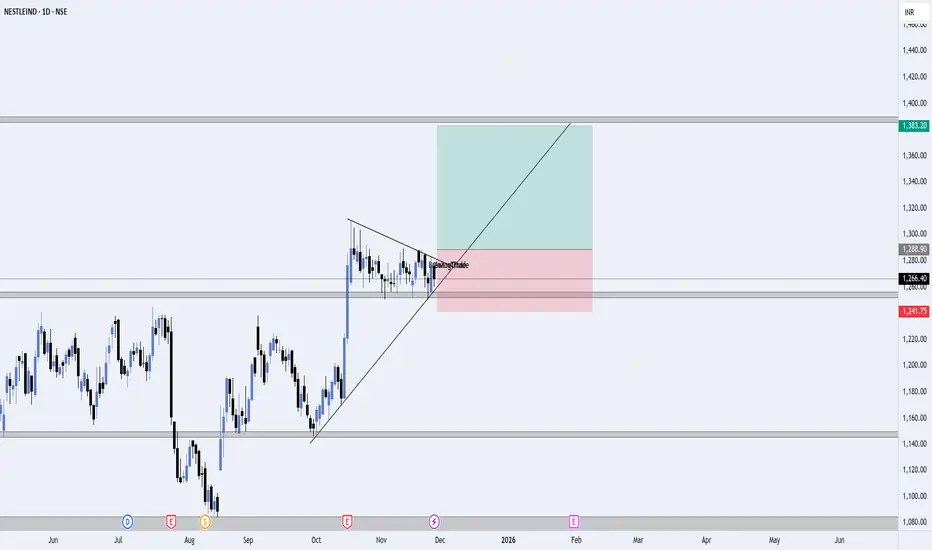
I’m watching Nestle India for a potential bullish breakout from a symmetrical triangle on the daily timeframe. Price has been consolidating after a strong impulsive move, and it is now respecting both trendline support and triangle resistance.
🔍 What I'm Seeing
Price created a strong rally, followed by a healthy consolidation.
A symmetrical triangle pattern has formed — showing tight price compression.
Price is currently sitting near the trendline support, indicating buyers are still active.
A breakout above the triangle could trigger the next bullish leg.
📈 Trade Idea
Entry Zone: Around current levels near the triangle breakout
Stop Loss: Placed below the trendline + recent swing lows
Target: Previous strong resistance zone near ₹1383
This gives a clean risk-to-reward setup with a logical structure: risk below support, target at the next major supply zone.
🎯 Why This Setup Makes Sense
Triangle breakout often leads to strong directional moves.
Trendline support confirms buyer strength.
Market structure is shifting bullish after breaking the downtrend earlier.
⚠️ Risk Note
This is not financial advice. Always manage risk properly and wait for a confirmed breakout candle before entering.
노트
Wait for clear Breakout Candle매매 수동청산
No Breakout Happend So pending order not executed면책사항
해당 정보와 게시물은 금융, 투자, 트레이딩 또는 기타 유형의 조언이나 권장 사항으로 간주되지 않으며, 트레이딩뷰에서 제공하거나 보증하는 것이 아닙니다. 자세한 내용은 이용 약관을 참조하세요.
면책사항
해당 정보와 게시물은 금융, 투자, 트레이딩 또는 기타 유형의 조언이나 권장 사항으로 간주되지 않으며, 트레이딩뷰에서 제공하거나 보증하는 것이 아닙니다. 자세한 내용은 이용 약관을 참조하세요.