Hello Crypto Friends! Let's take a look and see how NEOUSD is doing on the 4 Hour charts.
What's Going On:
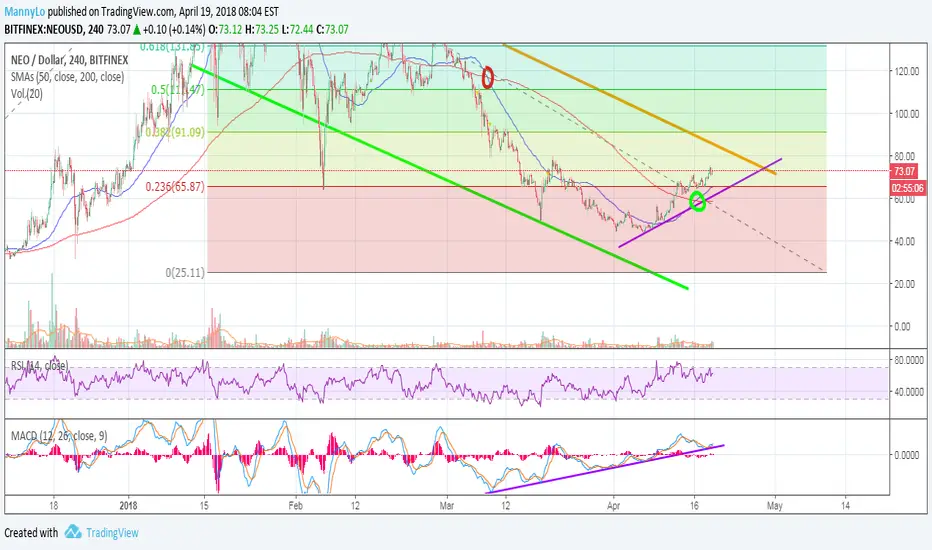
We can see on our chart that NEOUSD price is now above the 50 day moving average and the 200 day moving average which is a bullish sign.
We also see the green circle on our charts where the 50 day moving average has crossed above the 200 day moving average creating the famous "Golden Cross" we all love to see which is another bullish indicator. MACD is also looking positive and in an uptrend and RSI looks healthy currently staying between 50-75 at the moment.
What to Watch For:
While NEO is looking bullish at the moment, we would love to see it break resistance marked as the Orange downtrend line on our chart to confirm it has indeed broken out of the downtrend channel. A break above this orange resistance line in combination with the price pushing above the moving averages should be enough to confirm the reversal. The next 48 hours or so should be able to give us the answer to really see begin to see where NEO is heading, so stay tuned. If you like the analysis please shoot us a Like as we keep you updated on NEO's next move.
I am currently long on NEOUSD.
Cheers!
What's Going On:
We can see on our chart that NEOUSD price is now above the 50 day moving average and the 200 day moving average which is a bullish sign.
We also see the green circle on our charts where the 50 day moving average has crossed above the 200 day moving average creating the famous "Golden Cross" we all love to see which is another bullish indicator. MACD is also looking positive and in an uptrend and RSI looks healthy currently staying between 50-75 at the moment.
What to Watch For:
While NEO is looking bullish at the moment, we would love to see it break resistance marked as the Orange downtrend line on our chart to confirm it has indeed broken out of the downtrend channel. A break above this orange resistance line in combination with the price pushing above the moving averages should be enough to confirm the reversal. The next 48 hours or so should be able to give us the answer to really see begin to see where NEO is heading, so stay tuned. If you like the analysis please shoot us a Like as we keep you updated on NEO's next move.
I am currently long on NEOUSD.
Cheers!
면책사항
이 정보와 게시물은 TradingView에서 제공하거나 보증하는 금융, 투자, 거래 또는 기타 유형의 조언이나 권고 사항을 의미하거나 구성하지 않습니다. 자세한 내용은 이용 약관을 참고하세요.
면책사항
이 정보와 게시물은 TradingView에서 제공하거나 보증하는 금융, 투자, 거래 또는 기타 유형의 조언이나 권고 사항을 의미하거나 구성하지 않습니다. 자세한 내용은 이용 약관을 참고하세요.