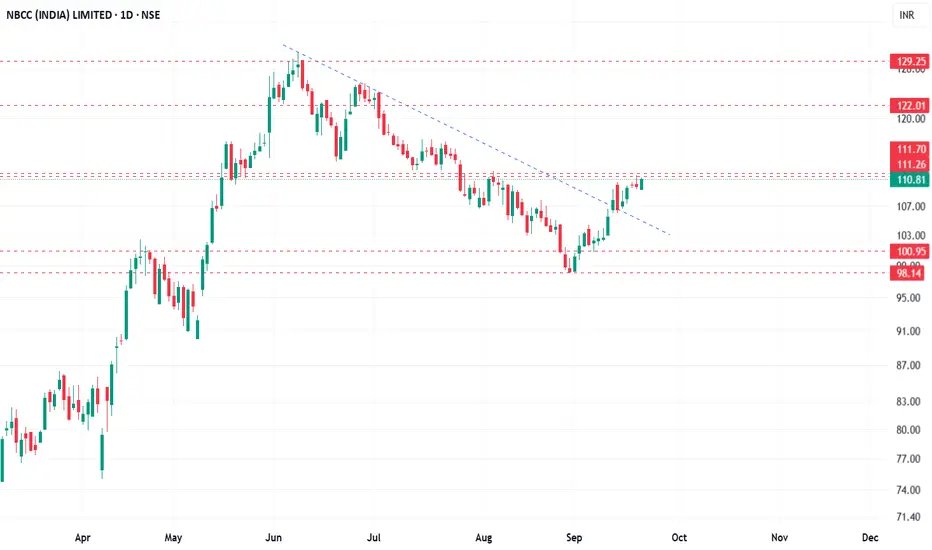
🔎 Technical Chart Analysis (Daily)
1. Price Structure & Trend
The stock rallied sharply till June 2025 (~₹129), followed by a correction.
Formed a falling trendline resistance, which has now been broken on the upside, indicating a shift from correction to recovery.
Currently consolidating around ₹110–112, which is a key resistance zone.
2. Key Levels
Immediate Support: ₹101, followed by ₹98.
Immediate Resistance: ₹111–112 (current hurdle).
Next Resistance: ₹122 and then ₹129 (previous swing high).
3. Pattern Observation
The stock is attempting a trend reversal breakout from a falling channel / descending trendline.
Sustaining above ₹112 can confirm short-term bullish momentum.
4. Momentum & Price Action
Short-term bullish momentum seen with higher lows from September.
A decisive close above ₹112 will invite fresh buying interest.
If rejected here, price may retest ₹101–₹103 zone before another attempt upward.
📈 Possible Scenarios
✅ Bullish Case
Breakout and sustain above ₹112 → Upside potential toward ₹122, and eventually retest ₹129 (swing high).
⚠️ Bearish Case
Rejection at ₹112 → Pullback toward supports at ₹101 and ₹98.
Breakdown below ₹98 may open downside to ₹92–95.
📝 Analyst View (Summary)
Trend: Recovering from correction, short-term reversal visible.
Key Zone to Watch: ₹111–112 breakout.
Bias: Positive above ₹101.
Targets (if breakout holds): ₹122 → ₹129.
⚠️ Disclaimer
This analysis is for educational and informational purposes only. It should not be considered investment advice or a recommendation to buy/sell. Equity investments involve risks. Please consult with financial advisor before making any investment decisions.
면책사항
이 정보와 게시물은 TradingView에서 제공하거나 보증하는 금융, 투자, 거래 또는 기타 유형의 조언이나 권고 사항을 의미하거나 구성하지 않습니다. 자세한 내용은 이용 약관을 참고하세요.
면책사항
이 정보와 게시물은 TradingView에서 제공하거나 보증하는 금융, 투자, 거래 또는 기타 유형의 조언이나 권고 사항을 의미하거나 구성하지 않습니다. 자세한 내용은 이용 약관을 참고하세요.