🔍 Key Highlights:
✅ XABCD Pattern Completion Zone:
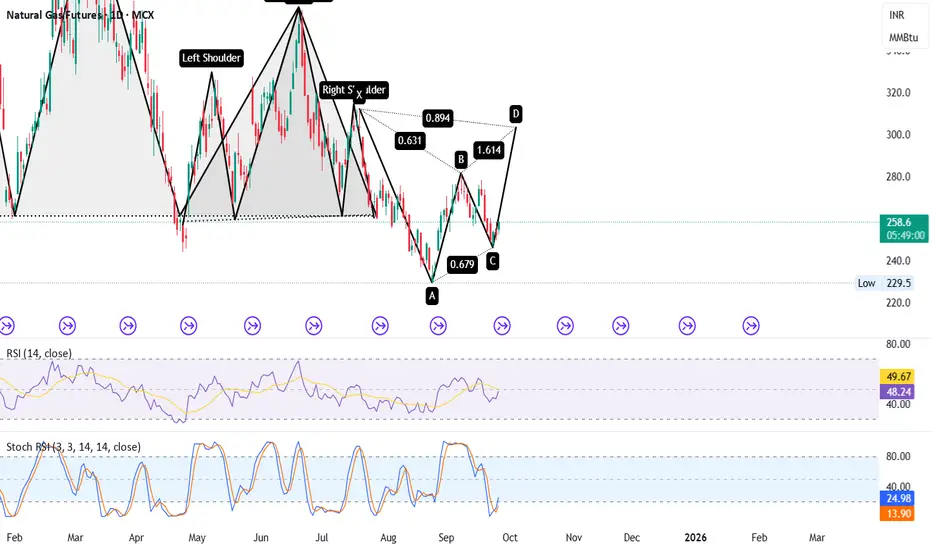
XA to AB = 0.631 retracement
BC = 0.679 retracement
CD = 1.614 extension (projected move towards Point D)
✅ Bullish Structure in Progress:
Hidden Inverse Head & Shoulder supports bullish reversal
Confluence near Point C, increasing probability of trend reversal
✅ Momentum Confirmation:
RSI bouncing from neutral zone (47–49)
Stoch RSI reversing from oversold zone (13–23) – signaling early long buildup
🎯 Key Levels to Watch:
📈 Upside Target Zone (D): 1.614 extension zone
🛑 Invalidation: Break below recent Point C Low (229.5)
💡 Trading Insight:
This setup aligns with harmonic precision. If price holds the recent low and reverses with volume, Natural Gas may witness a strong upside bounce into the D leg completion.
✅ XABCD Pattern Completion Zone:
XA to AB = 0.631 retracement
BC = 0.679 retracement
CD = 1.614 extension (projected move towards Point D)
✅ Bullish Structure in Progress:
Hidden Inverse Head & Shoulder supports bullish reversal
Confluence near Point C, increasing probability of trend reversal
✅ Momentum Confirmation:
RSI bouncing from neutral zone (47–49)
Stoch RSI reversing from oversold zone (13–23) – signaling early long buildup
🎯 Key Levels to Watch:
📈 Upside Target Zone (D): 1.614 extension zone
🛑 Invalidation: Break below recent Point C Low (229.5)
💡 Trading Insight:
This setup aligns with harmonic precision. If price holds the recent low and reverses with volume, Natural Gas may witness a strong upside bounce into the D leg completion.
면책사항
이 정보와 게시물은 TradingView에서 제공하거나 보증하는 금융, 투자, 거래 또는 기타 유형의 조언이나 권고 사항을 의미하거나 구성하지 않습니다. 자세한 내용은 이용 약관을 참고하세요.
면책사항
이 정보와 게시물은 TradingView에서 제공하거나 보증하는 금융, 투자, 거래 또는 기타 유형의 조언이나 권고 사항을 의미하거나 구성하지 않습니다. 자세한 내용은 이용 약관을 참고하세요.