📈 Chart Pattern: Bearish Harmonic (Possibly Bearish Bat or Gartley Variant)
⚠️ Price Structure Breakdown:
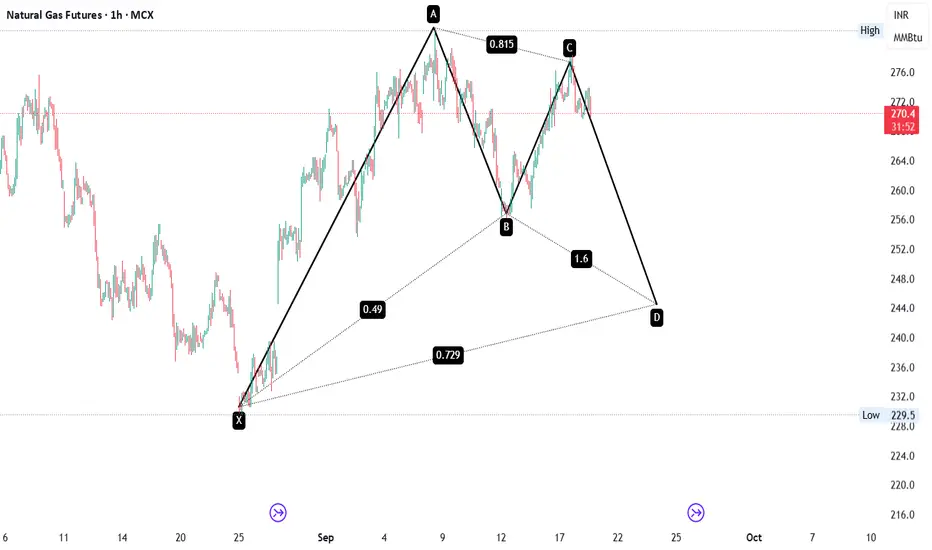
A clean XABCD Harmonic Pattern is visible on the 1H timeframe:
🔹 XA Leg: Sharp impulsive rally from ₹229 → ₹281
🔹 AB Leg: Pullback retraced 49% of XA
🔹 BC Leg: Strong recovery to 81.5% of AB
🔹 CD Projection: 1.6x extension of BC, projecting a potential D point near ₹244–248 zone
📌 Key Technical Highlights:
✅ Pattern in play: Bearish harmonic indicating upcoming correction phase
🧲 D target zone aligns with previous demand cluster from late August
🔄 Ideal reversal zone between ₹244–248 (Watch for price-action confirmation near D)
🎯 Possible Trade Setup (Anticipated Post Completion at Point D):
📉 Sell NG Futures near ₹244–248 (on reversal confirmation)
🎯 Targets: ₹234 → ₹229
🛑 SL: Above ₹251 (on closing basis)
🧠 Why This Matters:
Harmonic patterns like this, especially with clean Fibonacci alignment, often mark high-probability reversal zones. Combined with volume + divergence filters, this zone could provide a lucrative swing trade setup.
면책사항
해당 정보와 게시물은 금융, 투자, 트레이딩 또는 기타 유형의 조언이나 권장 사항으로 간주되지 않으며, 트레이딩뷰에서 제공하거나 보증하는 것이 아닙니다. 자세한 내용은 이용 약관을 참조하세요.
면책사항
해당 정보와 게시물은 금융, 투자, 트레이딩 또는 기타 유형의 조언이나 권장 사항으로 간주되지 않으며, 트레이딩뷰에서 제공하거나 보증하는 것이 아닙니다. 자세한 내용은 이용 약관을 참조하세요.