Bullish Positional Setup Emerging
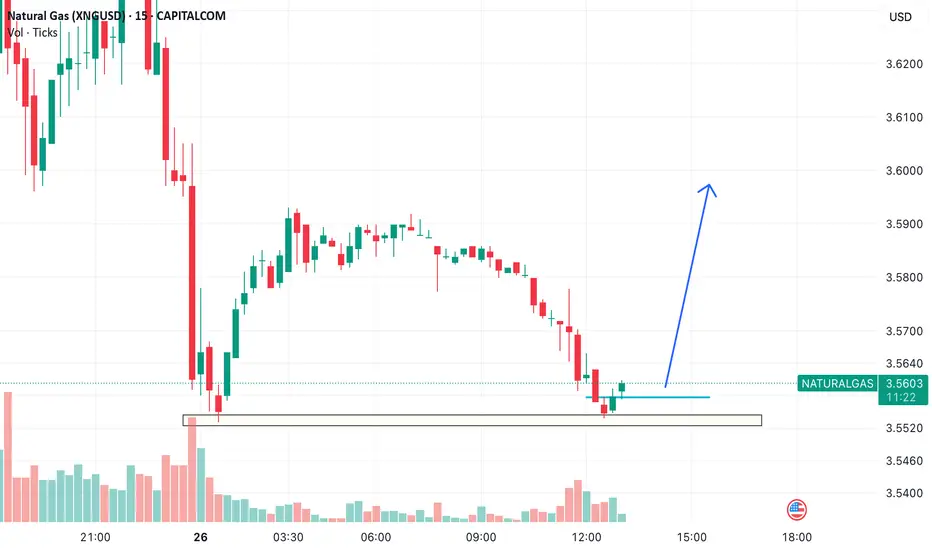
Despite relentless downward pressure, Natural Gas has landed into a previous demand pocket, holding the lows with surgical precision. A textbook case of seller exhaustion paired with invisible buying interest is unfolding on the 15-minute chart.
⸻
Structure Observation:
• Rejection from Key Demand Zone: The $3.55–$3.545 range has been tested twice and is being defended with volume.
• Volume Divergence: Notice the increasing red bars met with dry-up in follow-through selling — indicating distribution is likely over.
• Liquidity Sweep Setup: We’ve likely witnessed a liquidity grab under the prior support zone, shaking out weak hands before a move higher.
• Tight Accumulation: Price is stabilizing in a tight band — a typical precursor to vertical expansion if sustained above $3.56.
• Micro Timeframe Reversal: Subtle shift in market character. From lower highs/lows to possible higher low confirmation here.
⸻
The Trade – Stealthy Long
• Entry Zone: $3.56–$3.565 (as price reclaims structure)
• Stop Loss: Below $3.542 (just under demand)
• Target 1: $3.60 (supply shelf)
• Target 2: $3.625–$3.63 (gap-fill zone + fib confluence)
• Risk-Reward: ~1:2.5 to 1:3 — excellent reward-to-risk if the zone holds
⸻
This is the kind of setup where the market doesn’t scream; it whispers. The price doesn’t need to show fireworks — it just needs to stop bleeding, consolidate, and start climbing while everyone’s looking elsewhere. If this isn’t smart money accumulation, it’s doing a very good job pretending to be.
This is not about catching the bottom. It’s about understanding when the odds shift quietly in your favor.
⸻
Let it play out.
Let others react late.
You just needed to observe — and position early.
거래청산: 타겟 닿음
면책사항
이 정보와 게시물은 TradingView에서 제공하거나 보증하는 금융, 투자, 거래 또는 기타 유형의 조언이나 권고 사항을 의미하거나 구성하지 않습니다. 자세한 내용은 이용 약관을 참고하세요.
면책사항
이 정보와 게시물은 TradingView에서 제공하거나 보증하는 금융, 투자, 거래 또는 기타 유형의 조언이나 권고 사항을 의미하거나 구성하지 않습니다. 자세한 내용은 이용 약관을 참고하세요.