Current Price: $3.090
Technical View (Weekly Timeframe):
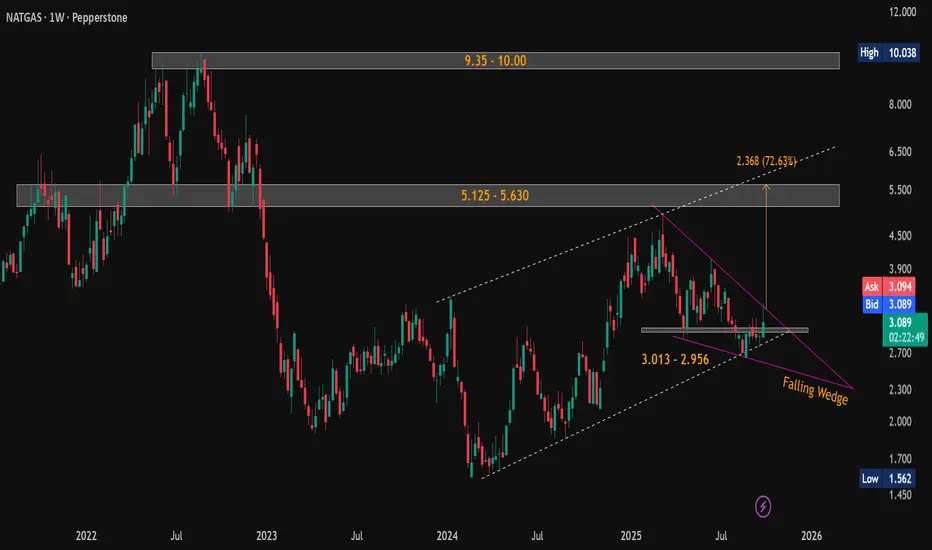
Natural Gas has formed a classic falling wedge pattern on the weekly chart - a strong bullish reversal setup. Price action is currently on the verge of breakout, with increasing volume and narrowing range suggesting imminent movement.
🟢 Strong Support Zones:
$3.013 – $2.956
$2.692 – $2.643
🔺 Key Resistance / Upside Targets:
Short-term: $5.125 – $5.630 (Pattern target: $5.625)
Long-term: $9.35 – $10.00
📈 The pattern breakout target of $5.625 aligns closely with the major resistance zone of $5.125 – $5.630, representing a potential ~80% upside from current levels.
Look for confirmed breakout above the wedge resistance with strong volume for trend continuation.
#NaturalGas | #NG | #FallingWedge | #ChartPatterns | #TechnicalAnalysis | #PriceAction
📌 Disclaimer: This analysis is shared for educational purposes only. It is not a buy/sell recommendation. Please do your own research before making any trading decisions.
Technical View (Weekly Timeframe):
Natural Gas has formed a classic falling wedge pattern on the weekly chart - a strong bullish reversal setup. Price action is currently on the verge of breakout, with increasing volume and narrowing range suggesting imminent movement.
🟢 Strong Support Zones:
$3.013 – $2.956
$2.692 – $2.643
🔺 Key Resistance / Upside Targets:
Short-term: $5.125 – $5.630 (Pattern target: $5.625)
Long-term: $9.35 – $10.00
📈 The pattern breakout target of $5.625 aligns closely with the major resistance zone of $5.125 – $5.630, representing a potential ~80% upside from current levels.
Look for confirmed breakout above the wedge resistance with strong volume for trend continuation.
#NaturalGas | #NG | #FallingWedge | #ChartPatterns | #TechnicalAnalysis | #PriceAction
📌 Disclaimer: This analysis is shared for educational purposes only. It is not a buy/sell recommendation. Please do your own research before making any trading decisions.
면책사항
해당 정보와 게시물은 금융, 투자, 트레이딩 또는 기타 유형의 조언이나 권장 사항으로 간주되지 않으며, 트레이딩뷰에서 제공하거나 보증하는 것이 아닙니다. 자세한 내용은 이용 약관을 참조하세요.
면책사항
해당 정보와 게시물은 금융, 투자, 트레이딩 또는 기타 유형의 조언이나 권장 사항으로 간주되지 않으며, 트레이딩뷰에서 제공하거나 보증하는 것이 아닙니다. 자세한 내용은 이용 약관을 참조하세요.