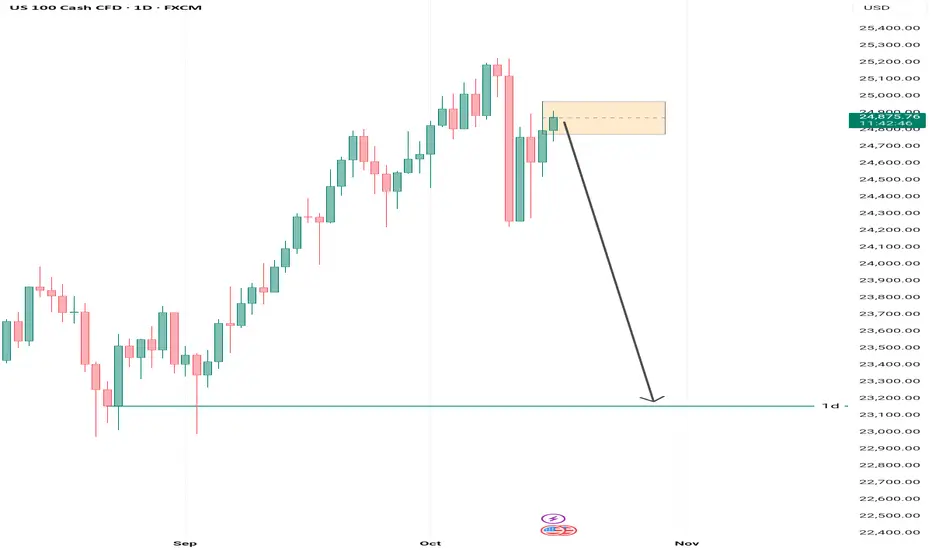
Based on the breakout observed on the 4-hour timeframe and its confirmation on the 30-minute chart — which itself was validated by the M5 structure break within the highlighted golden zone — we expect the price to continue its decline toward the first daily support level.
This setup provides a strong risk-to-reward ratio, as illustrated on the chart.
As always — stay patient, follow your plan, and trust your analysis.
면책사항
해당 정보와 게시물은 금융, 투자, 트레이딩 또는 기타 유형의 조언이나 권장 사항으로 간주되지 않으며, 트레이딩뷰에서 제공하거나 보증하는 것이 아닙니다. 자세한 내용은 이용 약관을 참조하세요.
면책사항
해당 정보와 게시물은 금융, 투자, 트레이딩 또는 기타 유형의 조언이나 권장 사항으로 간주되지 않으며, 트레이딩뷰에서 제공하거나 보증하는 것이 아닙니다. 자세한 내용은 이용 약관을 참조하세요.