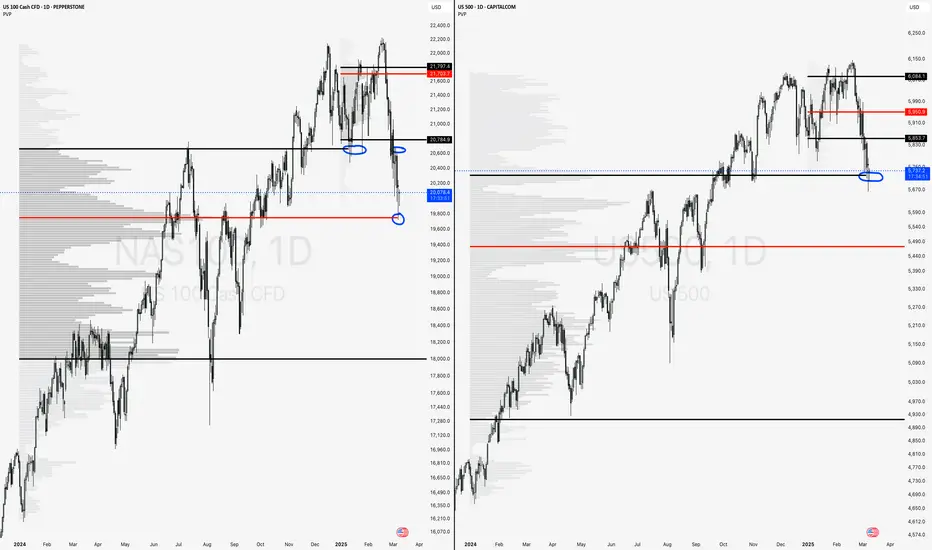
The charts shown are highlighting the 12 month periodic volume profile chart. Currently, the S&P 500 and Nasdaq 100 are bouncing off major 2024 value areas.
Nasdaq 100:
Last week we can see how bulls lost the 2024 value area high (VAH) and couldn't reclaim. As a result we swiftly moved down to the point of control (POC) where we found buyers show up.
S&P 500:
Coincidently, the S&P 500 moved down to the 2024 VAH where it also found buyers show up.
Moving Forward:
These areas remain very important and should be monitored going forward. If a bounce is to happen here, bulls would like to see the Nasdaq reclaim the 2024 VAH and even work back into the current 2025 VAL.
면책사항
이 정보와 게시물은 TradingView에서 제공하거나 보증하는 금융, 투자, 거래 또는 기타 유형의 조언이나 권고 사항을 의미하거나 구성하지 않습니다. 자세한 내용은 이용 약관을 참고하세요.
면책사항
이 정보와 게시물은 TradingView에서 제공하거나 보증하는 금융, 투자, 거래 또는 기타 유형의 조언이나 권고 사항을 의미하거나 구성하지 않습니다. 자세한 내용은 이용 약관을 참고하세요.