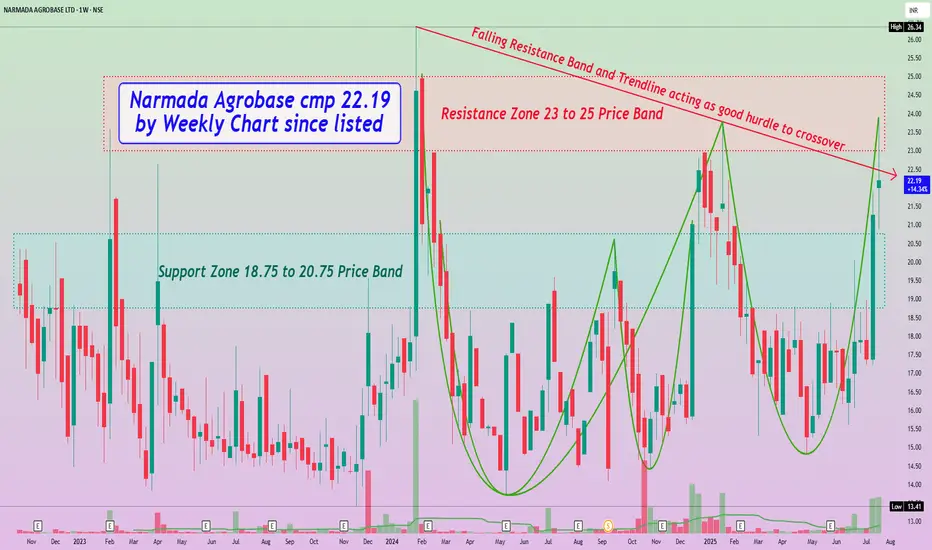
Narmada Agrobase cmp 22.19 by Weekly Chart since listed
- Support Zone 18.75 to 20.75 Price Band
- Resistance Zone seen at 23 to 25 Price Band
- Falling Resistance Band and Trendline acting as good hurdle to crossover
- Back to Back Bullish Rounding Bottoms formed at Resistance Zone neckline hurdle
- Volumes have spiked up heavily over past 2 weeks well above average traded quantity
- Most common Technical Indicators like BB, EMA, MACD, RSI, SAR are showing positive trend
면책사항
해당 정보와 게시물은 금융, 투자, 트레이딩 또는 기타 유형의 조언이나 권장 사항으로 간주되지 않으며, 트레이딩뷰에서 제공하거나 보증하는 것이 아닙니다. 자세한 내용은 이용 약관을 참조하세요.
면책사항
해당 정보와 게시물은 금융, 투자, 트레이딩 또는 기타 유형의 조언이나 권장 사항으로 간주되지 않으며, 트레이딩뷰에서 제공하거나 보증하는 것이 아닙니다. 자세한 내용은 이용 약관을 참조하세요.