How to Trade an Ascending Triangle
Here’s how traders can approach a stock that’s forming an ascending triangle pattern.
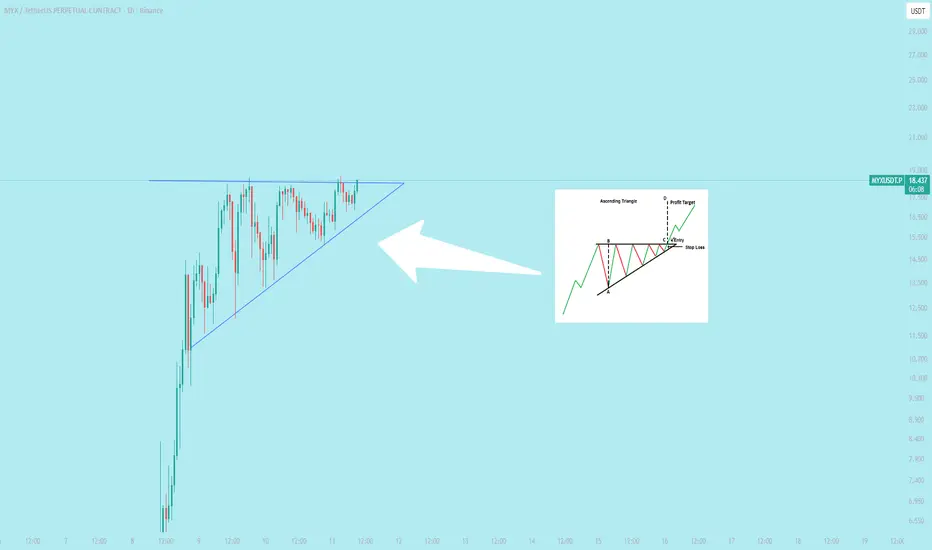
Step 1: Identify the Pattern Formation
To find an ascending triangle pattern, look for a stock that had a strong uptrend and is now trading sideways. A horizontal area of resistance should be clearly visible in the chart, while drawing trendline across the stock’s lows should yield an ascending line.
Step 2: Wait for the Breakout
Ascending chart patterns can take weeks to months to fully develop. Each new test of the resistance area has the potential to break out, but traders should be wary of false breakouts. A sustained breakout will typically be accompanied by above-average trading volume. The closer the ascending trendline comes to meeting the horizontal resistance line, the more likely a breakout is to occur.
Step 3: Enter a Trade
Traders can enter a bullish trade once a breakout is confirmed.
Step 4: Exit the Trade
The expected price movement of the breakout is equal to the price difference at the widest part of the ascending triangle pattern. You can measure the distance between the resistance area and the lowest low at the start of the pattern and add that to the resistance area to calculate a profit target for the trade.
Here’s how traders can approach a stock that’s forming an ascending triangle pattern.
Step 1: Identify the Pattern Formation
To find an ascending triangle pattern, look for a stock that had a strong uptrend and is now trading sideways. A horizontal area of resistance should be clearly visible in the chart, while drawing trendline across the stock’s lows should yield an ascending line.
Step 2: Wait for the Breakout
Ascending chart patterns can take weeks to months to fully develop. Each new test of the resistance area has the potential to break out, but traders should be wary of false breakouts. A sustained breakout will typically be accompanied by above-average trading volume. The closer the ascending trendline comes to meeting the horizontal resistance line, the more likely a breakout is to occur.
Step 3: Enter a Trade
Traders can enter a bullish trade once a breakout is confirmed.
Step 4: Exit the Trade
The expected price movement of the breakout is equal to the price difference at the widest part of the ascending triangle pattern. You can measure the distance between the resistance area and the lowest low at the start of the pattern and add that to the resistance area to calculate a profit target for the trade.
액티브 트레이드
PERFECT BREAKDOWN면책사항
해당 정보와 게시물은 금융, 투자, 트레이딩 또는 기타 유형의 조언이나 권장 사항으로 간주되지 않으며, 트레이딩뷰에서 제공하거나 보증하는 것이 아닙니다. 자세한 내용은 이용 약관을 참조하세요.
면책사항
해당 정보와 게시물은 금융, 투자, 트레이딩 또는 기타 유형의 조언이나 권장 사항으로 간주되지 않으며, 트레이딩뷰에서 제공하거나 보증하는 것이 아닙니다. 자세한 내용은 이용 약관을 참조하세요.