롱
MYROUSDT Bullish Breakout Above Triangle Resistance!
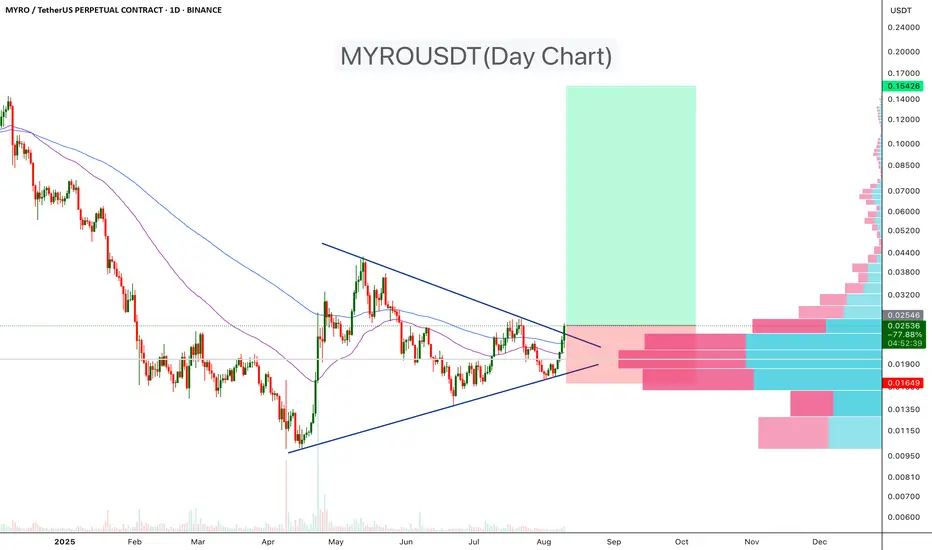
MYROUSDT has been trading within a symmetrical triangle pattern for the past few months. Today, the price has broken above the upper trendline, signaling a potential bullish breakout. The breakout is supported by increased volume and a clear move above both the 50-day and 100-day EMAs, suggesting strengthening bullish momentum.
Pattern: Symmetrical Triangle (Bullish breakout)
Breakout Confirmation: Price closed above the upper trendline with increased volume
Moving Averages: Trading above the 50 EMA and 100 EMA – bullish bias
Target: 150%–500%
Stop-loss: Below triangle support (~$0.0165)
Cheers
Hexa
Pattern: Symmetrical Triangle (Bullish breakout)
Breakout Confirmation: Price closed above the upper trendline with increased volume
Moving Averages: Trading above the 50 EMA and 100 EMA – bullish bias
Target: 150%–500%
Stop-loss: Below triangle support (~$0.0165)
Cheers
Hexa
🚀Telegram : t.me/hexatrades
🌐Website: hexatrades.io/
🗣️Twitter(X): twitter.com/HexaTrades
🌐Website: hexatrades.io/
🗣️Twitter(X): twitter.com/HexaTrades
관련 발행물
면책사항
해당 정보와 게시물은 금융, 투자, 트레이딩 또는 기타 유형의 조언이나 권장 사항으로 간주되지 않으며, 트레이딩뷰에서 제공하거나 보증하는 것이 아닙니다. 자세한 내용은 이용 약관을 참조하세요.
🚀Telegram : t.me/hexatrades
🌐Website: hexatrades.io/
🗣️Twitter(X): twitter.com/HexaTrades
🌐Website: hexatrades.io/
🗣️Twitter(X): twitter.com/HexaTrades
관련 발행물
면책사항
해당 정보와 게시물은 금융, 투자, 트레이딩 또는 기타 유형의 조언이나 권장 사항으로 간주되지 않으며, 트레이딩뷰에서 제공하거나 보증하는 것이 아닙니다. 자세한 내용은 이용 약관을 참조하세요.