Not an Advisor.
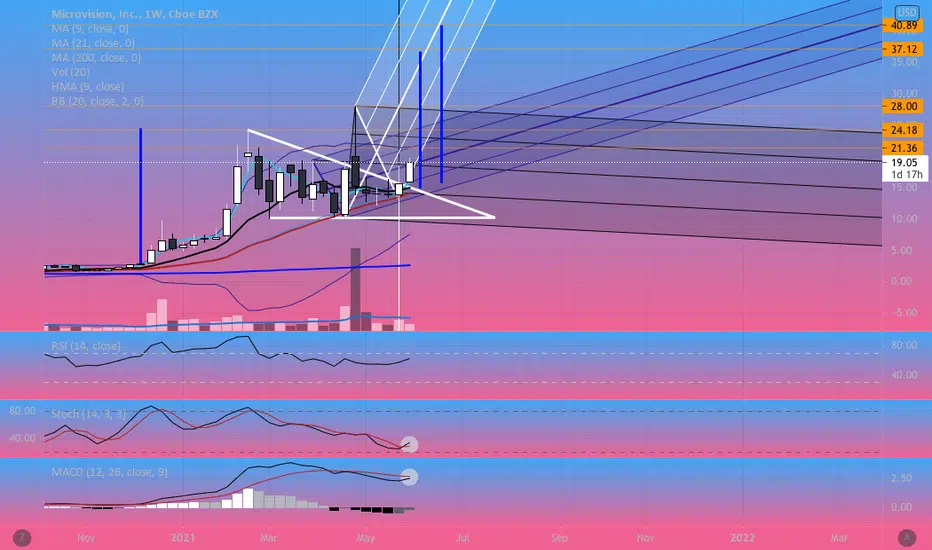
This chart is a bit messy so I apologize in advance. Weekly Chart for MVIS is showing monster potential.
Looking to cross bullish on the MACD
Stoch lines are looking like they may start that movement upward signaling strength to come to this chart.
RSI is only at 62! Plenty of room to run here.
Still awaiting on Volume to match the weekly average of just a bit over 100 million, currently at half of that with 2 days left this week of trading.
Watching this closely to see what pitchforks further get validated with price action this week.
Blue lines are flag measurements to gather price targets.
Gold lines are areas of previous resistance/ support. Also price targets.
면책사항
해당 정보와 게시물은 금융, 투자, 트레이딩 또는 기타 유형의 조언이나 권장 사항으로 간주되지 않으며, 트레이딩뷰에서 제공하거나 보증하는 것이 아닙니다. 자세한 내용은 이용 약관을 참조하세요.
면책사항
해당 정보와 게시물은 금융, 투자, 트레이딩 또는 기타 유형의 조언이나 권장 사항으로 간주되지 않으며, 트레이딩뷰에서 제공하거나 보증하는 것이 아닙니다. 자세한 내용은 이용 약관을 참조하세요.