MSTU – Sitting Right on a 2H Demand
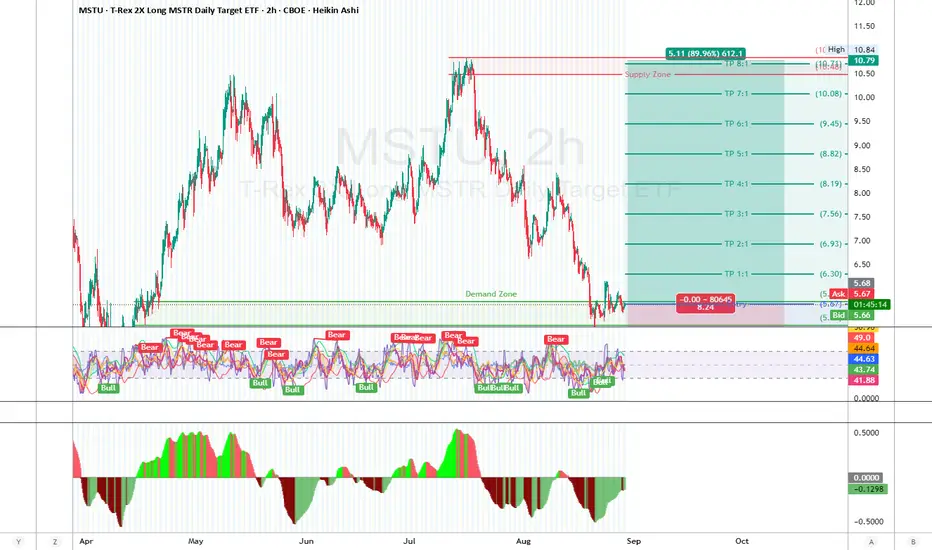
MSTU has been in free fall since that 10.80 peak. Now, it’s parked right at a big demand zone (5.20–5.50) — the same area that held earlier this year.
MSTU is basically a leveraged bet on Bitcoin + MicroStrategy earnings.
MSTR just posted Q2: revenue flat, still net loss, but the big story = they now hold 226,500 BTC at ~$35.3K avg cost.
🟩 Demand Zone
5.20–5.50 → tested multiple times, still holding strong.
🟥 Supply Zone
10.50–10.80 → the area where sellers dumped hard.
RSI/Stoch Signals: After weeks of “Bear” signals, we’re now seeing a string of fresh “Bull” flashes as price stabilizes. Momentum is shifting.
MACD Histogram: Still slightly red, but starting to flatten out. If it flips green, that’s the trigger.
🎯 Trade Setup
Entry: Anywhere 5.50–5.70 (demand zone buy)
Stop Loss: 5.06 (below demand breakdown)
Target: 10.80 (major supply)
Risk/Reward: ~1:8 RR → high payoff if demand holds.
Trade Management
Move stop to Break Even once price clears 7.00.
Scale out partials near 8.50.
Let a runner ride into 10.50–10.80 for the home run.
“The best trades often feel the hardest to take.”
This one? It feels tough to buy because the chart looks wrecked — but that’s often when demand zones do their best work.
⚠️ Disclaimer
This is just my trading plan — not financial advice. MSTU is a leveraged ETF = big upside, but also amplified downside. Size small, manage risk.
거래청산: 스탑 닿음
Entered at a deeper zoneBy Dubai Traders Hub
Follow us on X , YouTube, and Join our Telegram Channel
Follow us on X , YouTube, and Join our Telegram Channel
면책사항
이 정보와 게시물은 TradingView에서 제공하거나 보증하는 금융, 투자, 거래 또는 기타 유형의 조언이나 권고 사항을 의미하거나 구성하지 않습니다. 자세한 내용은 이용 약관을 참고하세요.
By Dubai Traders Hub
Follow us on X , YouTube, and Join our Telegram Channel
Follow us on X , YouTube, and Join our Telegram Channel
면책사항
이 정보와 게시물은 TradingView에서 제공하거나 보증하는 금융, 투자, 거래 또는 기타 유형의 조언이나 권고 사항을 의미하거나 구성하지 않습니다. 자세한 내용은 이용 약관을 참고하세요.