I’m watching MicroStrategy (MSTR) closely here — the chart is setting up for what looks like a strong bullish opportunity.
(the content below is documenting the chart from left to right)
🔎 Key Observations
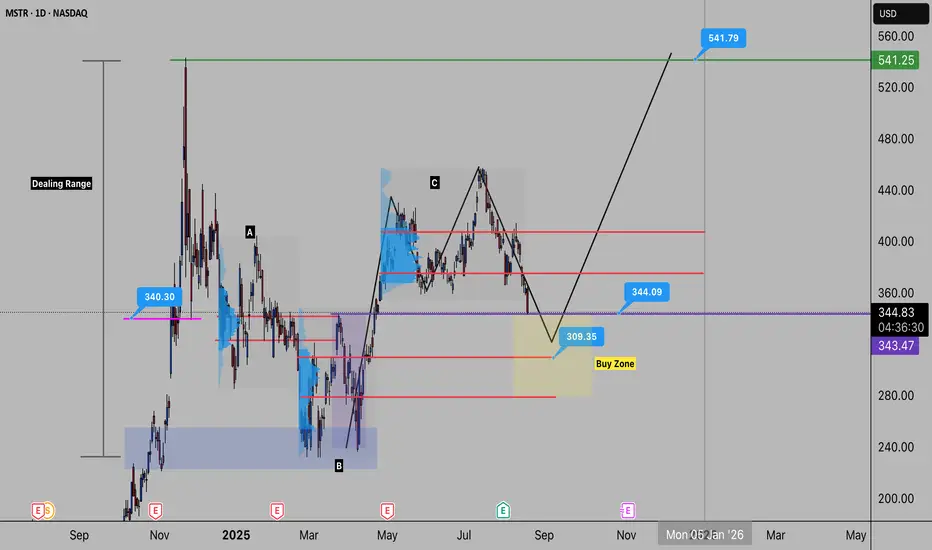
Demand Zone: Back in August 2024, price reacted strongly from the $225 zone, rallying ~100%. Clear evidence of institutional demand.
Current Structure: Price has been ranging between $225 – $550. The midpoint zone (~$325–$375) is where the most important reactions are likely to form.
Volume Zones:
Zone A → Already tested.
Zone B → Untested, showing potential bullish reaction.
Zone C → Looks bearish on the surface, but could be a manipulation zone (push down to fill institutional orders).
Liquidity Sweep: The purple zone shows price ran weekly highs, reversed, then closed back above — a classic liquidity grab, suggesting institutions may defend this area.
🧩 Market Structure & Pattern
Structure shows a bullish impulse with a crab pattern forming.
Completion expected around 50–61.8% retracement, possibly as deep as 78.6%.
Buy zone of interest: $325.
🎯 Trade Plan
Entry Zone: $325 area.
Targets:
First resistance: $375–$400 (must clear here).
Final target: $550.
Bias: Bullish, holding for continuation higher as long as $225 remains protected.
✅ To summarize: I’m bullish on MicroStrategy here. Watching for a buy reaction around $325 with a target of $550. Price will need to prove itself through the $375–$400 zone before continuation.
(the content below is documenting the chart from left to right)
🔎 Key Observations
Demand Zone: Back in August 2024, price reacted strongly from the $225 zone, rallying ~100%. Clear evidence of institutional demand.
Current Structure: Price has been ranging between $225 – $550. The midpoint zone (~$325–$375) is where the most important reactions are likely to form.
Volume Zones:
Zone A → Already tested.
Zone B → Untested, showing potential bullish reaction.
Zone C → Looks bearish on the surface, but could be a manipulation zone (push down to fill institutional orders).
Liquidity Sweep: The purple zone shows price ran weekly highs, reversed, then closed back above — a classic liquidity grab, suggesting institutions may defend this area.
🧩 Market Structure & Pattern
Structure shows a bullish impulse with a crab pattern forming.
Completion expected around 50–61.8% retracement, possibly as deep as 78.6%.
Buy zone of interest: $325.
🎯 Trade Plan
Entry Zone: $325 area.
Targets:
First resistance: $375–$400 (must clear here).
Final target: $550.
Bias: Bullish, holding for continuation higher as long as $225 remains protected.
✅ To summarize: I’m bullish on MicroStrategy here. Watching for a buy reaction around $325 with a target of $550. Price will need to prove itself through the $375–$400 zone before continuation.
면책사항
이 정보와 게시물은 TradingView에서 제공하거나 보증하는 금융, 투자, 거래 또는 기타 유형의 조언이나 권고 사항을 의미하거나 구성하지 않습니다. 자세한 내용은 이용 약관을 참고하세요.
면책사항
이 정보와 게시물은 TradingView에서 제공하거나 보증하는 금융, 투자, 거래 또는 기타 유형의 조언이나 권고 사항을 의미하거나 구성하지 않습니다. 자세한 내용은 이용 약관을 참고하세요.