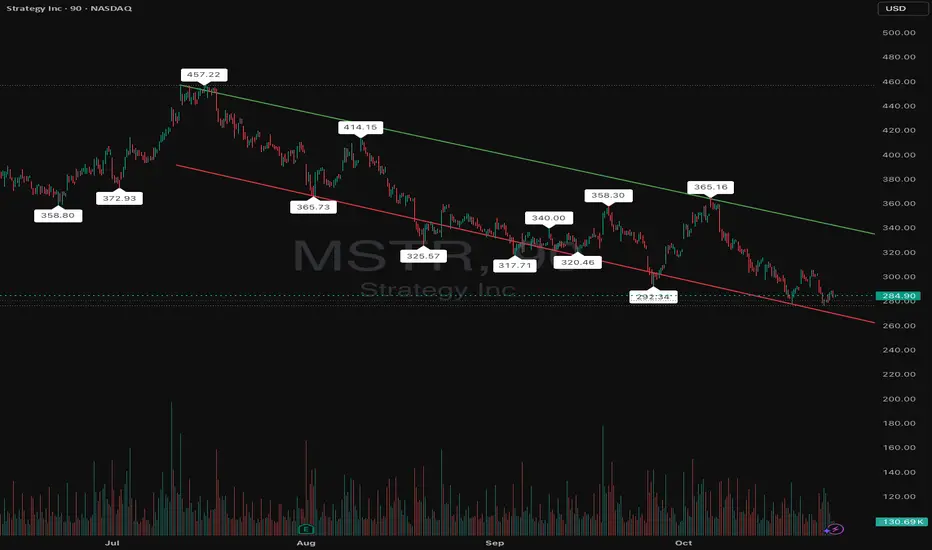
MSTR (MicroStrategy Inc.) is trading within a well-defined descending channel that has persisted since July. The stock continues to make lower highs and lower lows, reflecting a strong bearish trend. It is currently testing the lower channel support around the $284–$285 area, a zone that has previously triggered short-term rebounds. If MSTR can hold this level and reclaim $300, a potential bounce toward the mid-channel region around $320–$340 could follow. However, a breakdown below $280 may signal further downside toward $265 or even $250. Overall, the stock is at a critical inflection point where traders are watching to see whether the support holds or the downtrend resumes.
Bullish Scenario (Countertrend play):
Entry near $285 with tight stop below $275 -Target $320–$340
Bearish Scenario (Trend continuation):
Wait for breakdown below $280.
Target $265 then $250 -Stop above $300
Bullish Scenario (Countertrend play):
Entry near $285 with tight stop below $275 -Target $320–$340
Bearish Scenario (Trend continuation):
Wait for breakdown below $280.
Target $265 then $250 -Stop above $300
면책사항
해당 정보와 게시물은 금융, 투자, 트레이딩 또는 기타 유형의 조언이나 권장 사항으로 간주되지 않으며, 트레이딩뷰에서 제공하거나 보증하는 것이 아닙니다. 자세한 내용은 이용 약관을 참조하세요.
면책사항
해당 정보와 게시물은 금융, 투자, 트레이딩 또는 기타 유형의 조언이나 권장 사항으로 간주되지 않으며, 트레이딩뷰에서 제공하거나 보증하는 것이 아닙니다. 자세한 내용은 이용 약관을 참조하세요.