https://www.tradingview.com/x/QGzalipN/
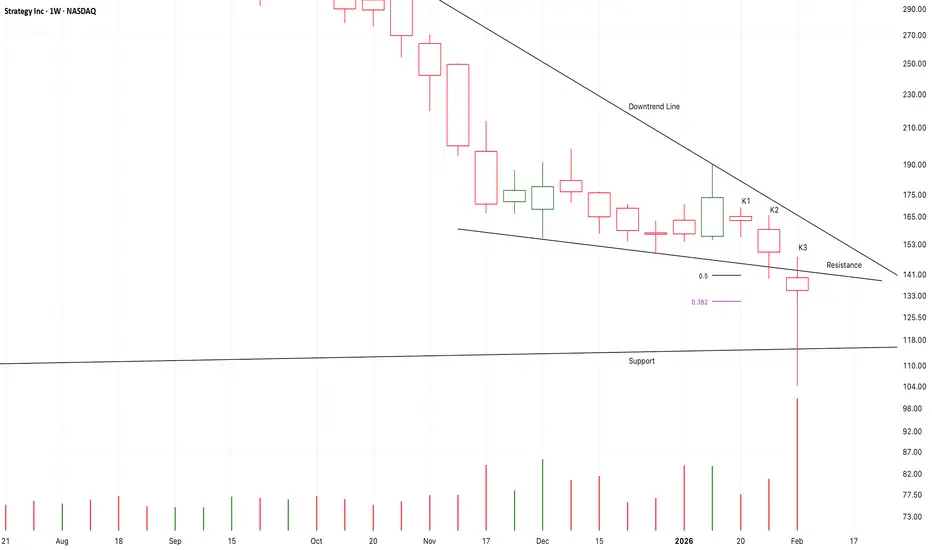
K3 verified a potential support here,
Perhaps it is an earlier signal of a potential bear bottom.
But it must break up the nearest downtrend line here,
And, the support must be verified by more tests.
It takes more time for a bear bottom than a bull top.
If the following candles fall to test the support,
I will try to buy it.
I am expecting the bear market of the bitcoin price target at about 56-50K area.
면책사항
해당 정보와 게시물은 금융, 투자, 트레이딩 또는 기타 유형의 조언이나 권장 사항으로 간주되지 않으며, 트레이딩뷰에서 제공하거나 보증하는 것이 아닙니다. 자세한 내용은 이용 약관을 참조하세요.
면책사항
해당 정보와 게시물은 금융, 투자, 트레이딩 또는 기타 유형의 조언이나 권장 사항으로 간주되지 않으며, 트레이딩뷰에서 제공하거나 보증하는 것이 아닙니다. 자세한 내용은 이용 약관을 참조하세요.