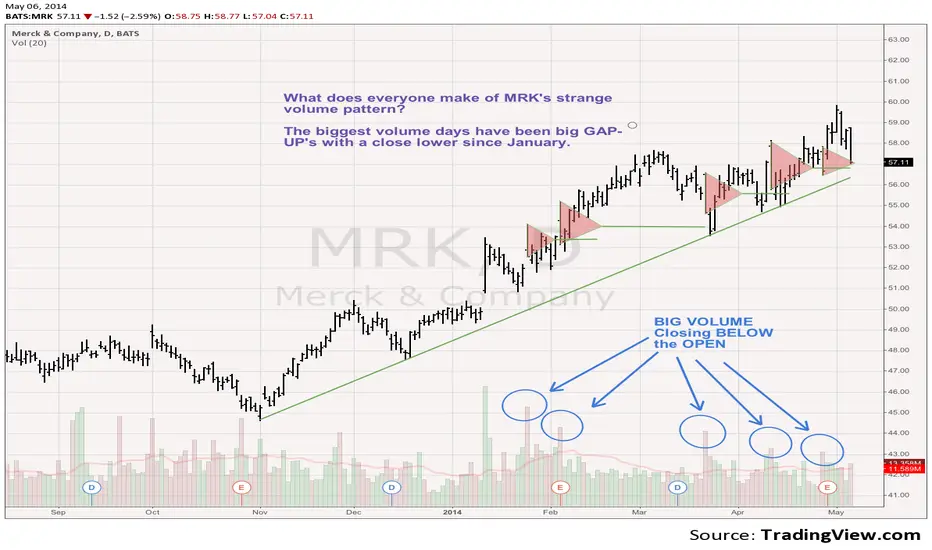
What do you make of this pattern of volume in Merck MRK here on the daily chart?
Each time this has happened since January it has moved higher, but I think it is distribution by a massive seller, akin to the days of Jesse Livermore. It is so unusual that I'd have to say in my nearly 30 years of watching charts that I haven't seen a chart look like this before. If MRK can break under one of these support lines, then it could mark the end of this uptrend. Granted I don't see tremendous downside risk, perhaps 10% or so.
Strategy: Sell short going under 57 with a 59 stop. Target initially 54-53.
Tim 4:16PM EST, May 6, 2014 57.11 last -1.52
Subscribe to my indicator package KEY HIDDEN LEVELS $10/mo or $100/year and join me in the trading room KEY HIDDEN LEVELS here at TradingView.com
면책사항
이 정보와 게시물은 TradingView에서 제공하거나 보증하는 금융, 투자, 거래 또는 기타 유형의 조언이나 권고 사항을 의미하거나 구성하지 않습니다. 자세한 내용은 이용 약관을 참고하세요.
면책사항
이 정보와 게시물은 TradingView에서 제공하거나 보증하는 금융, 투자, 거래 또는 기타 유형의 조언이나 권고 사항을 의미하거나 구성하지 않습니다. 자세한 내용은 이용 약관을 참고하세요.