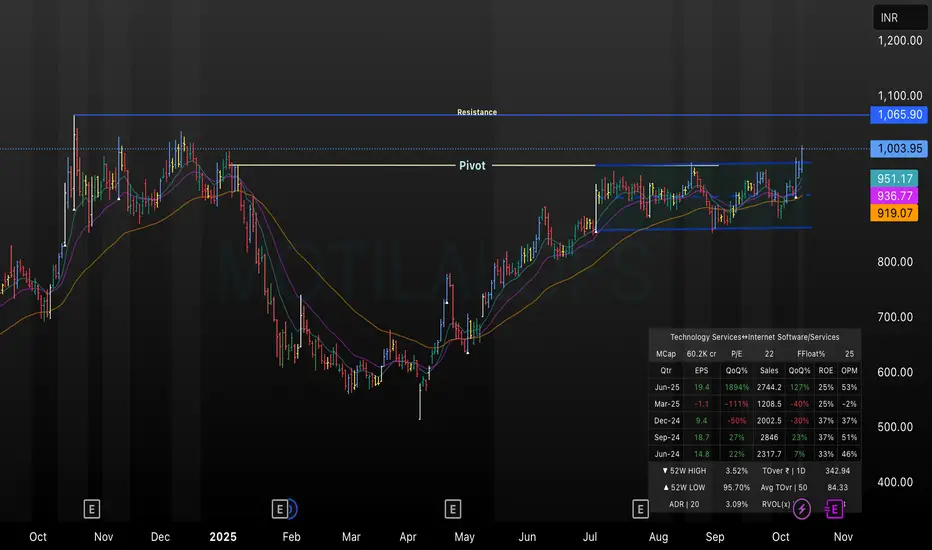
This TradingView chart for Motilal Oswal shows a clear price breakout above the key pivot level near ₹1,003.95, heading towards the marked resistance at ₹1,065.90. The chart uses daily candles and overlays short-to-medium-term EMAs, highlighting recent bullish momentum. The setup suggests a potential trend continuation if the resistance is breached, with all technicals and critical financial data displayed for context.
면책사항
해당 정보와 게시물은 금융, 투자, 트레이딩 또는 기타 유형의 조언이나 권장 사항으로 간주되지 않으며, 트레이딩뷰에서 제공하거나 보증하는 것이 아닙니다. 자세한 내용은 이용 약관을 참조하세요.
면책사항
해당 정보와 게시물은 금융, 투자, 트레이딩 또는 기타 유형의 조언이나 권장 사항으로 간주되지 않으며, 트레이딩뷰에서 제공하거나 보증하는 것이 아닙니다. 자세한 내용은 이용 약관을 참조하세요.