Hey there!
Date: August 21, 2025
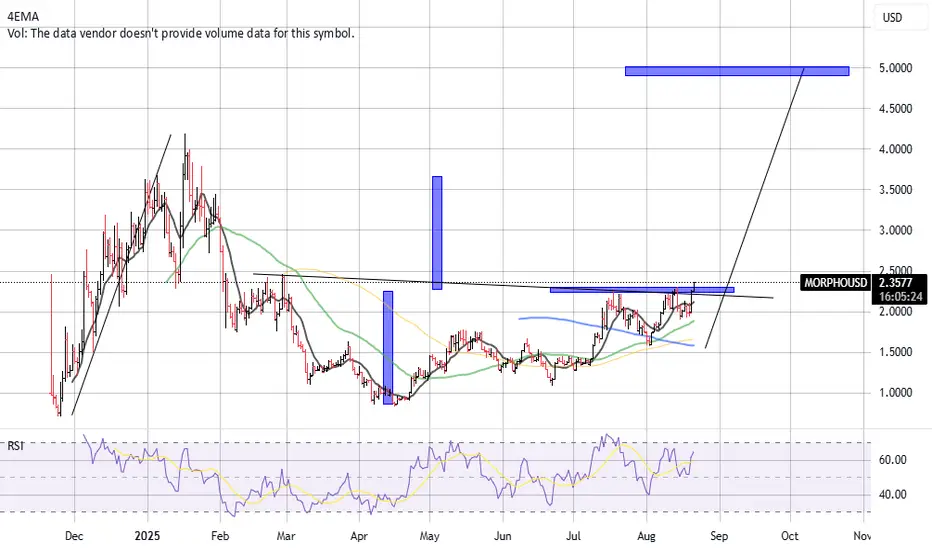
MORPH/USDT is consolidating right below a critical resistance zone and appears to be preparing for a breakout. If confirmed, the upside potential is significant.
🔍 Technical Overview:
Current Price: $2.35
EMA Levels:
4EMA: $2.11
50EMA: $1.87
100EMA: $1.65
200EMA: $1.57
The price is currently trading above all major EMAs, showing strong bullish alignment.
📊 Structure & Price Action:
Price has been consolidating under the $2.35–2.40 resistance zone, repeatedly testing it.
A clean horizontal resistance line is visible; a breakout above this level would unlock higher targets.
The recent higher lows indicate buyers are in control and pushing price upward.
📉 Key Support Levels:
$2.11 (4EMA dynamic support)
$1.87 (50EMA)
$1.65–$1.57 (deep retracement supports near 100/200EMA)
📈 Key Resistance & Target Zones:
Immediate resistance: $2.35–2.40
Breakout target: $5.00 zone (major measured move target marked on chart)
📊 Indicators:
RSI: 64.53 – In bullish territory but not overbought, leaving room for continuation.
No volume data available on this chart, but the structure itself suggests accumulation near resistance.
🎯 Bullish Outlook:
Trend: Bullish structure with higher lows and EMA alignment
Breakout above $2.40 could trigger a sharp move toward $5.00
Pullbacks to $2.10–$2.00 may offer good re-entry opportunities for continuation traders
📉 Invalidation:
A rejection and breakdown below $1.87 would weaken the structure
Loss of the $1.65–1.57 zone would invalidate the bullish breakout setup
Good Trading :-)
Date: August 21, 2025
MORPH/USDT is consolidating right below a critical resistance zone and appears to be preparing for a breakout. If confirmed, the upside potential is significant.
🔍 Technical Overview:
Current Price: $2.35
EMA Levels:
4EMA: $2.11
50EMA: $1.87
100EMA: $1.65
200EMA: $1.57
The price is currently trading above all major EMAs, showing strong bullish alignment.
📊 Structure & Price Action:
Price has been consolidating under the $2.35–2.40 resistance zone, repeatedly testing it.
A clean horizontal resistance line is visible; a breakout above this level would unlock higher targets.
The recent higher lows indicate buyers are in control and pushing price upward.
📉 Key Support Levels:
$2.11 (4EMA dynamic support)
$1.87 (50EMA)
$1.65–$1.57 (deep retracement supports near 100/200EMA)
📈 Key Resistance & Target Zones:
Immediate resistance: $2.35–2.40
Breakout target: $5.00 zone (major measured move target marked on chart)
📊 Indicators:
RSI: 64.53 – In bullish territory but not overbought, leaving room for continuation.
No volume data available on this chart, but the structure itself suggests accumulation near resistance.
🎯 Bullish Outlook:
Trend: Bullish structure with higher lows and EMA alignment
Breakout above $2.40 could trigger a sharp move toward $5.00
Pullbacks to $2.10–$2.00 may offer good re-entry opportunities for continuation traders
📉 Invalidation:
A rejection and breakdown below $1.87 would weaken the structure
Loss of the $1.65–1.57 zone would invalidate the bullish breakout setup
Good Trading :-)
거래청산: 스탑 닿음
big break out, but it returned back , stop hitted , we are re evaluate, even the markets turbulence ;-) Who Dares always Wins!
My contact on Telegram: @Etelve
My contact on Telegram: @Etelve
면책사항
해당 정보와 게시물은 금융, 투자, 트레이딩 또는 기타 유형의 조언이나 권장 사항으로 간주되지 않으며, 트레이딩뷰에서 제공하거나 보증하는 것이 아닙니다. 자세한 내용은 이용 약관을 참조하세요.
Who Dares always Wins!
My contact on Telegram: @Etelve
My contact on Telegram: @Etelve
면책사항
해당 정보와 게시물은 금융, 투자, 트레이딩 또는 기타 유형의 조언이나 권장 사항으로 간주되지 않으며, 트레이딩뷰에서 제공하거나 보증하는 것이 아닙니다. 자세한 내용은 이용 약관을 참조하세요.