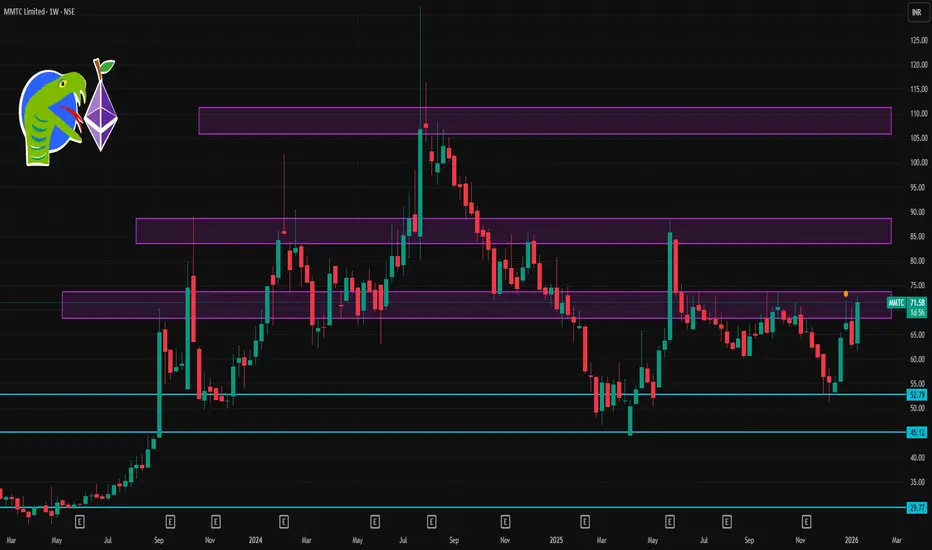
📌 Current Price Snapshot
Latest traded price: ~₹71.5 – ₹72.7 on NSE today with strong intraday volatility. Daily high ~₹72.70 and low ~₹63.86.
This wide daily range suggests higher volatility this week — at least through the next few sessions.
📊 Short‑Term Weekly Levels
🔹 Resistance (Upside)
These are levels where price may face selling pressure or slow gains:
1. ₹72.5 – ₹73.0 — Immediate resistance area (today’s local high).
2. ₹75.0 – ₹76.0 — Next bullish pivot region if the stock holds above ₹72.5 (based on momentum models).
3. ₹78.0 – ₹80.0 — Stronger weekly upward pull target if bullish continuation holds.
👉 Closing above ₹75 on the weekly timeframe would indicate stronger short‑term bullish structure.
🔻 Support (Downside)
Levels where buyers may step in on pullbacks:
1. ₹66.0 – ₹67.0 — First dynamic support (near shorter moving averages).
2. ₹62.0 – ₹63.5 — Key lower support zone (recent daily lows).
3. ₹60.0 – ₹61.0 — Deeper weekly support — important to watch if breakdown accelerates.
👉 A break below ₹62 on weekly closes would weaken the bullish outlook and could open the door toward deeper supports.
📈 Technical Indicator Context
Technical breadth is largely bullish/momentum supportive:
📌 Moving Averages:
5, 10, 20, 50, 100, and 200‑day MAs all skew Buy — suggesting bullish trend alignment.
📌 RSI (14): ~65 — trending up but not yet extremely overbought.
📌 Stoch/RSI: Overbought on shorter timeframes — may hint at near‑term consolidation before higher breakout.
Summary: Momentum still skewed bullish overall, but short‑term traders should watch for near‑term pullbacks or consolidations due to overbought signals.
관련 발행물
면책사항
해당 정보와 게시물은 금융, 투자, 트레이딩 또는 기타 유형의 조언이나 권장 사항으로 간주되지 않으며, 트레이딩뷰에서 제공하거나 보증하는 것이 아닙니다. 자세한 내용은 이용 약관을 참조하세요.
관련 발행물
면책사항
해당 정보와 게시물은 금융, 투자, 트레이딩 또는 기타 유형의 조언이나 권장 사항으로 간주되지 않으며, 트레이딩뷰에서 제공하거나 보증하는 것이 아닙니다. 자세한 내용은 이용 약관을 참조하세요.