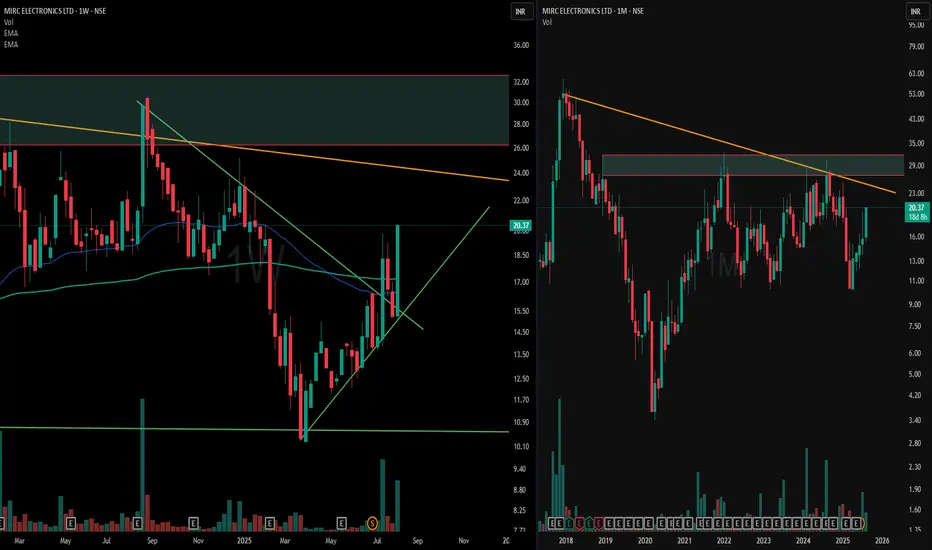
📊 Left Chart – Weekly Timeframe (WTF)
Price shifted from a series of lower highs/lows to forming a W-bottom entirely below the 200 & 50 EMA. Post-recovery, it moved into a channel consolidation, held by a green ascending support and capped by a green counter-trendline, creating a clean geometric structure.
📈 Right Chart – Monthly Timeframe (MTF)
A broader view reveals multi-fold hindrances, with red & orange trendlines marking a multi-year counter-trend. Each upside push faces historical resistance near the supply zone.
📝 Editorial Note:
Not a forecast — simply a snapshot of evolving structure from compressed weekly action to obstacle-heavy monthly context.
🎯 Master My Self-Made Trading Strategy
📈 Telegram (Learn Today): t.me/hashtaghammer
✅ WhatsApp (Learn Today): wa.me/919455664601
📈 Telegram (Learn Today): t.me/hashtaghammer
✅ WhatsApp (Learn Today): wa.me/919455664601
관련 발행물
면책사항
해당 정보와 게시물은 금융, 투자, 트레이딩 또는 기타 유형의 조언이나 권장 사항으로 간주되지 않으며, 트레이딩뷰에서 제공하거나 보증하는 것이 아닙니다. 자세한 내용은 이용 약관을 참조하세요.