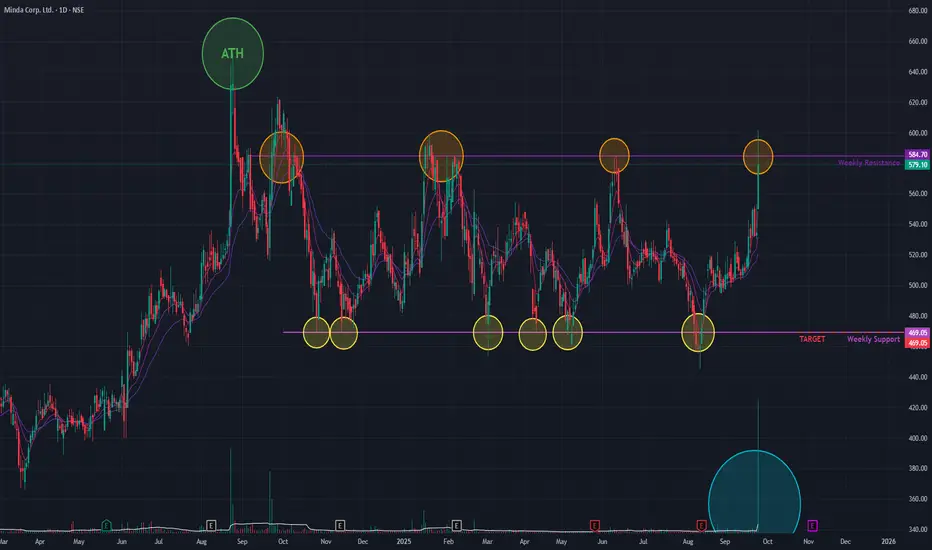
Minda Corp is making a powerful attempt to break out of a prolonged consolidation phase that has been in place since its All-Time High in August 2024. Today, the stock surged +8.34% on the back of exceptionally high trading volume—the largest spike seen in a considerable time.
The stock challenged a major resistance trendline that has been a barrier since September 2024, rejecting multiple breakout attempts. While today's price action breached this level intra-day, it failed to achieve a close above it, signaling that the battle between buyers and sellers at this critical juncture is not yet over.
Broad-Based Bullish Signals 👍
Despite the failed closing, the underlying technical picture is strong, with multiple indicators suggesting a bullish bias:
- Multi-Timeframe Strength: The short-term Exponential Moving Averages (EMAs) and the Relative Strength Index (RSI) are all indicating bullish crossovers on the monthly, weekly, and daily charts.
- Volume Thrust: Today's massive volume spike underscores the significant buying interest at this resistance level, even if it was not enough to secure a close above it.
Outlook: Awaiting a Decisive Close
The stock is at a critical inflection point. A decisive close above the resistance line on high volume is now required to confirm a true breakout.
- Bullish Case 📈: If a confirmed breakout occurs and the momentum is sustained, the next potential target is the resistance zone near ₹701.
- Bearish Case 📉: If the stock is rejected again at this level, it could fall back to the lower end of its consolidation range, with a potential support level near ₹469. The price action in the coming days will be crucial.
Disclaimer: This analysis is my personal view & for educational purposes only. They shall not be construed as trade or investment advice. Before making any financial decision, it is imperative that you consult with a qualified financial professional.
면책사항
이 정보와 게시물은 TradingView에서 제공하거나 보증하는 금융, 투자, 거래 또는 기타 유형의 조언이나 권고 사항을 의미하거나 구성하지 않습니다. 자세한 내용은 이용 약관을 참고하세요.