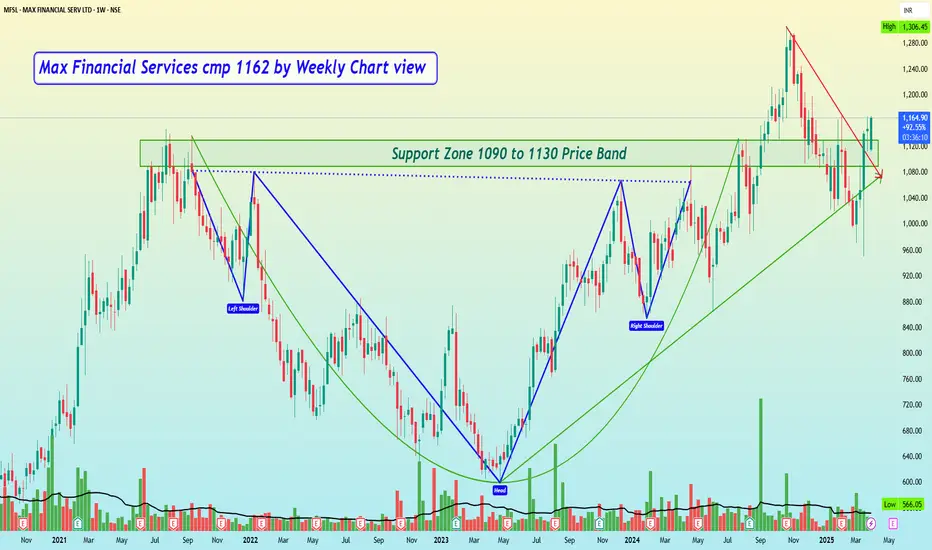
Max Financial Services cmp 1162 by Weekly Chart view
- Support Zone 1090 to 1130 Price Band
- Resistance Zone 1200 to 1245 Price Band
- Volumes getting in close sync with average traded quantity indicating demand based buying
- Price respecting Rising Support Trendline and sustaining Breakout above Falling Resistance Trendline
- Support is going thru the test and retesting phase with a faint breakout in the making process seen clearly
- Multiple intertwined Bullish Patterns of Rounding Bottom, Cup & Handle, Head & Shoulders, as one may observe and interpret
면책사항
해당 정보와 게시물은 금융, 투자, 트레이딩 또는 기타 유형의 조언이나 권장 사항으로 간주되지 않으며, 트레이딩뷰에서 제공하거나 보증하는 것이 아닙니다. 자세한 내용은 이용 약관을 참조하세요.
면책사항
해당 정보와 게시물은 금융, 투자, 트레이딩 또는 기타 유형의 조언이나 권장 사항으로 간주되지 않으며, 트레이딩뷰에서 제공하거나 보증하는 것이 아닙니다. 자세한 내용은 이용 약관을 참조하세요.