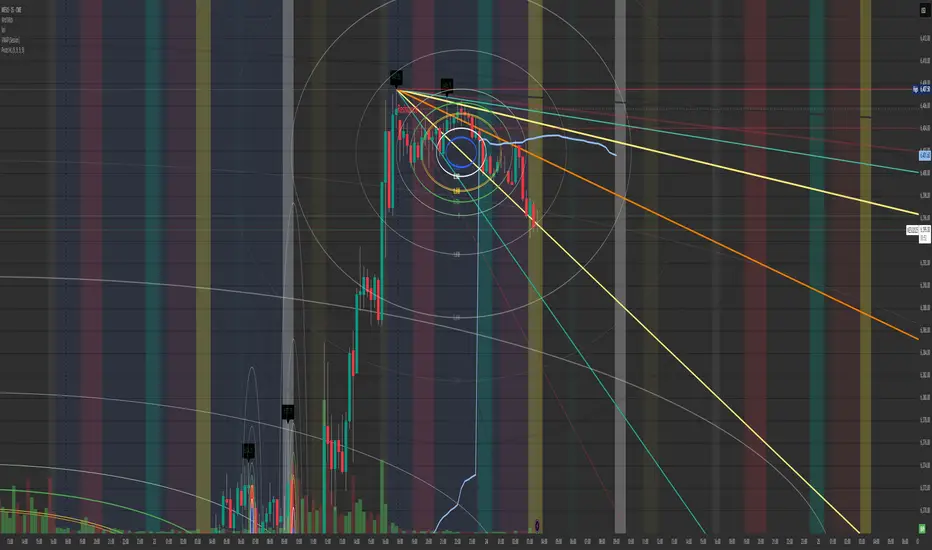
Looking at the Fib Circles and the previous day high along with the Gann. Well I know this is the micro ES but they run at the same % of p/l. If you notice how the high during yesterdays session and the low. Notice the Blue circle in the center?
Any and every time I can draw out the circle from high to low daily levels from past to current. (as you have seen in my previous examples.) Either the trend completely hits the limit of the blue circle. Than reverts to the buyers stepping up or sellers dropping down below the blue circle. Its like a plague to the momentum of the market and can change it in any direction.
I have noticed this as well. If the bid/ask price is within it during the time of the candle. It jumps or completely runs down through it meaning that I believe its a good place to either buy in any uptrend or sell in a Monthly/weekly/daily/hourly analytic.
That's what the Gann Fibonacci level tool is useful for in my eyes. If the trend keeps going down below any level I find that there's probably about a 10%-20% chance it will keep going down.
For me the Gann Is better than any trendline because it shows the fib along with the trend.
Not investment advice just a perspective I have had working with it since someone showed the wrong way. Than I remembered Highs first down to Lows of the tf, being it 15 min/hourly/daily/Weekly/Monthly.
Just a thought
Anyone have any opinions?
If so give me a ring and follow so I can get chart ideas that will great fully improve my futures trades.
Have a profitable day and be safe all.
Paul.
면책사항
해당 정보와 게시물은 금융, 투자, 트레이딩 또는 기타 유형의 조언이나 권장 사항으로 간주되지 않으며, 트레이딩뷰에서 제공하거나 보증하는 것이 아닙니다. 자세한 내용은 이용 약관을 참조하세요.
면책사항
해당 정보와 게시물은 금융, 투자, 트레이딩 또는 기타 유형의 조언이나 권장 사항으로 간주되지 않으며, 트레이딩뷰에서 제공하거나 보증하는 것이 아닙니다. 자세한 내용은 이용 약관을 참조하세요.