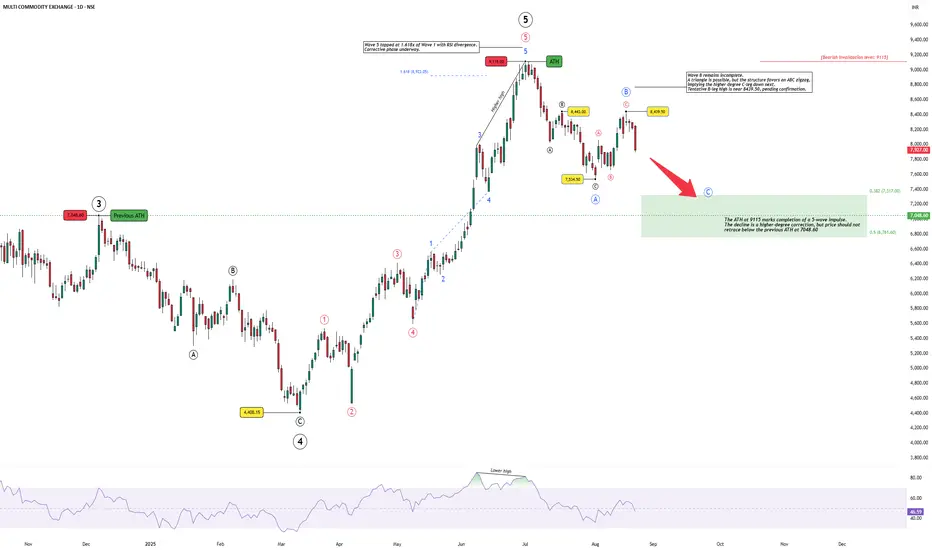
The rally in MCX reached its climax at 9115, which now marks the completion of a full 5-wave impulse sequence. Wave 5 stretched to 1.618x of Wave 1 and was accompanied by RSI divergence, a classic signal of exhaustion. This makes the top at 9115 significant, not just as an all-time high, but as the end of a higher-degree cycle.
From here, the market is unfolding into a higher-degree corrective phase. The immediate decline from the top appears corrective in nature, with an incomplete Wave B still in progress. While a triangle remains a possibility, the structure currently favors a simple ABC zigzag, implying that a C-leg down may follow.
The important level to watch is 7048.60, the previous ATH. Price should ideally hold above this zone to preserve the broader impulsive character of the rally. A sustained move below it would weaken the bullish outlook and raise the risk of a deeper correction.
At the same time, 9115 now serves as the bearish invalidation level. If price were to break above this peak, it would negate the current corrective view and open the possibility of a new bullish sequence unfolding.
In summary, the long-term uptrend has reached a natural pause. The near-term focus will be on how the correction develops — whether 7048.60 can provide support or whether the corrective leg extends deeper, with 9115 acting as the critical line in the sand for bearish continuation.
Disclaimer: This analysis is for educational purposes only and does not constitute investment advice. Please do your own research (DYOR) before making any trading decisions.
WaveXplorer | Elliott Wave insights
📊 X profile: @veerappa89
📊 X profile: @veerappa89
면책사항
이 정보와 게시물은 TradingView에서 제공하거나 보증하는 금융, 투자, 거래 또는 기타 유형의 조언이나 권고 사항을 의미하거나 구성하지 않습니다. 자세한 내용은 이용 약관을 참고하세요.
WaveXplorer | Elliott Wave insights
📊 X profile: @veerappa89
📊 X profile: @veerappa89
면책사항
이 정보와 게시물은 TradingView에서 제공하거나 보증하는 금융, 투자, 거래 또는 기타 유형의 조언이나 권고 사항을 의미하거나 구성하지 않습니다. 자세한 내용은 이용 약관을 참고하세요.