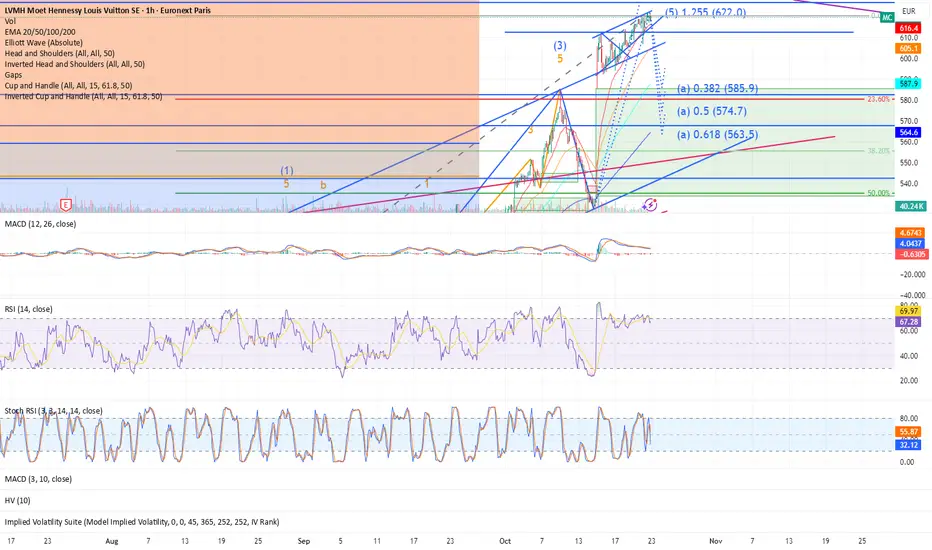
The MACD displays a clear bearish divergence — while price continues to make higher highs, the MACD is trending lower, confirming waning momentum. Similarly, the RSI recently peaked near 70 and has begun to flatten, reinforcing the loss of bullish strength. Volume has also declined noticeably throughout the consolidation, suggesting buyer fatigue.
Given these factors, I expect the stock to retest support around €585, with the possibility of a deeper correction toward €563. With some patience, this pullback could present an attractive long entry once momentum resets and confirmation of support emerges.
For further analysis on LVMH and an explanation of my long-term bullish sentiment for the stock please read:
https://www.tradingview.com/chart/1MC/6BavYEIF-LVMH-at-a-Turning-Point-Testing-Critical-Resistance-Ahead/
액티브 트레이드
The stock is starting to form a clear bullish "Cup and Handle" chart pattern. Keep your eyes open don't miss out! Waiting for breakout confirmation from handle's resistance.면책사항
해당 정보와 게시물은 금융, 투자, 트레이딩 또는 기타 유형의 조언이나 권장 사항으로 간주되지 않으며, 트레이딩뷰에서 제공하거나 보증하는 것이 아닙니다. 자세한 내용은 이용 약관을 참조하세요.
면책사항
해당 정보와 게시물은 금융, 투자, 트레이딩 또는 기타 유형의 조언이나 권장 사항으로 간주되지 않으며, 트레이딩뷰에서 제공하거나 보증하는 것이 아닙니다. 자세한 내용은 이용 약관을 참조하세요.