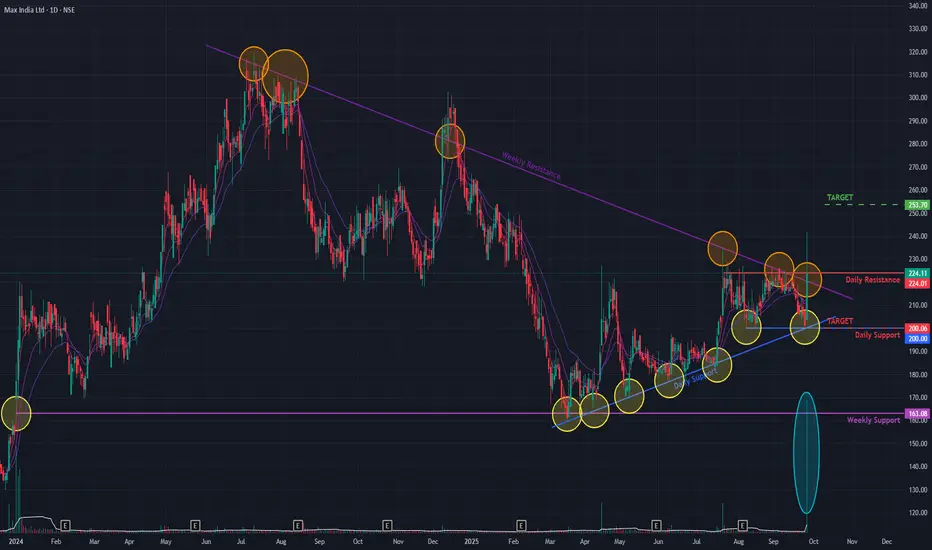
Max India has shown a significant bullish development, decisively breaking out of two key resistance levels today. The stock breached both a long-term angular resistance trendline from July 2024 and a short-term resistance from July 2025. This powerful move was confirmed by a massive surge of +14.95% on the back of exceptionally high trading volume, with the stock closing at ₹224.11.
This breakout signals a potential acceleration of the reversal that began in March 2025, following a prolonged downtrend from the stock's All-Time High in July 2024.
A Mix of Bullish Indicators 👍
The technical landscape shows a confluence of positive signals, although some are still developing:
- Broad Momentum: The Relative Strength Index (RSI) is in a bullish crossover state on both the weekly and daily charts, confirming strong momentum.
- Long-Term Strength: A Golden Crossover appeared on the daily chart a few days ago, providing a strong long-term bullish signal.
- Developing Confirmation: While short-term Exponential Moving Averages (EMAs) show a bullish crossover on the weekly chart, they have not yet confirmed this on the daily timeframe, suggesting immediate-term momentum is still catching up.
Outlook: Awaiting Confirmation
While the breakout is powerful, re-confirmation is prudent. A common technical event is a retest of the broken resistance levels as new support.
- Bullish Case 📈: If the momentum continues and the breakout is sustained, the next potential target on the upside is the ₹250 resistance level.
- Bearish Case 📉: If the breakout fails to hold and momentum subsides, the stock could pull back to find support near the ₹200 level.
Disclaimer: This analysis is my personal view & for educational purposes only. They shall not be construed as trade or investment advice. Before making any financial decision, it is imperative that you consult with a qualified financial professional.
면책사항
이 정보와 게시물은 TradingView에서 제공하거나 보증하는 금융, 투자, 거래 또는 기타 유형의 조언이나 권고 사항을 의미하거나 구성하지 않습니다. 자세한 내용은 이용 약관을 참고하세요.