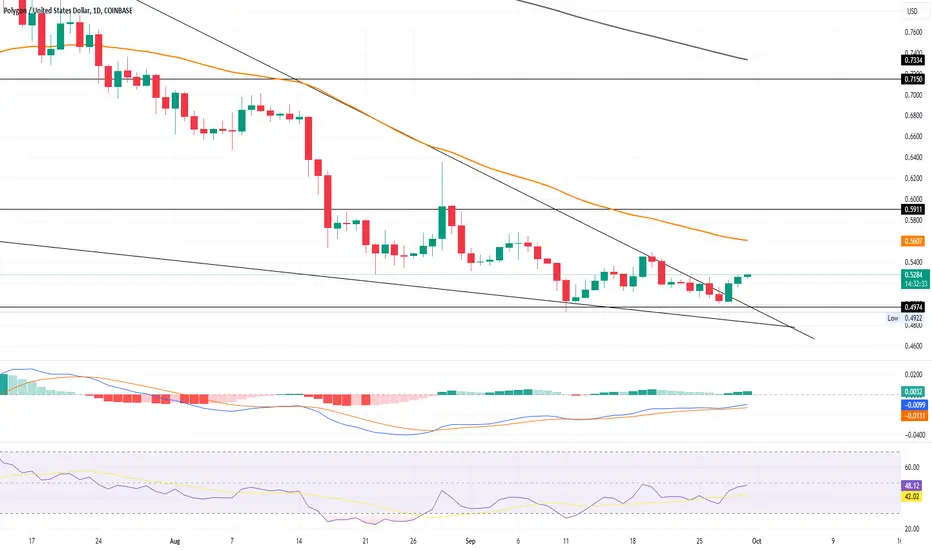
MATIC price action shows a potential bullish reversal.
The 50-day EMA has been a major resistance, keeping bullish growth in check.
A trendline breakout could unleash a new bullish rally.
MATIC has been in a long-term downtrend, leading to a death cross.
Recent support found at $0.49, teasing a potential reversal.
The price is currently trading at $0.52, with a 5.23% jump in the last two days.
A double bottom pattern is forming, signaling a potential trend reversal.
A morning star pattern has also formed, adding to bullish indicators.
MACD and signal lines avoid a bearish crossover, indicating bullish momentum.
RSI struggles to break above the halfway mark but remains above the 14-day SMA.
Upcoming resistance levels are at $0.59 and $0.71.
Failure to sustain the uptrend could see the price drop to $0.42.
면책사항
이 정보와 게시물은 TradingView에서 제공하거나 보증하는 금융, 투자, 거래 또는 기타 유형의 조언이나 권고 사항을 의미하거나 구성하지 않습니다. 자세한 내용은 이용 약관을 참고하세요.
면책사항
이 정보와 게시물은 TradingView에서 제공하거나 보증하는 금융, 투자, 거래 또는 기타 유형의 조언이나 권고 사항을 의미하거나 구성하지 않습니다. 자세한 내용은 이용 약관을 참고하세요.