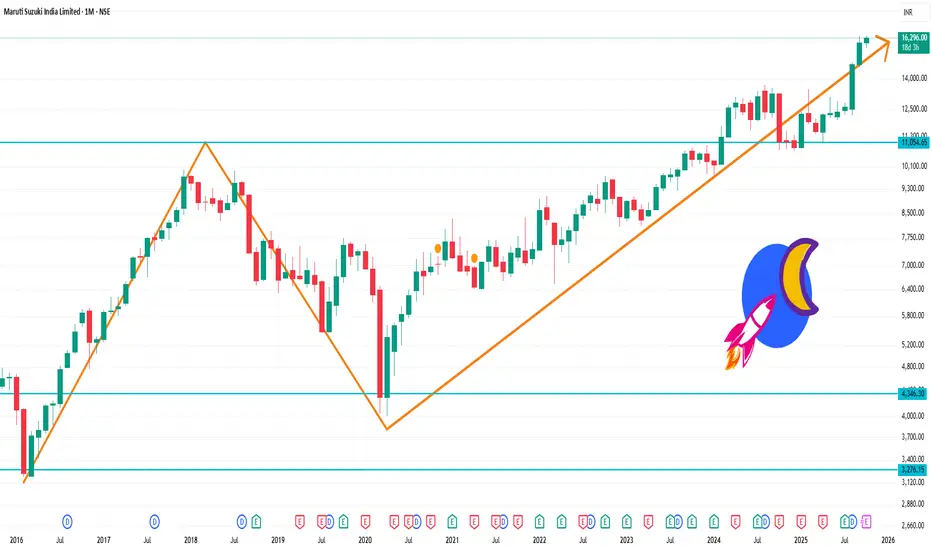
📊 Monthly Support & Resistance Levels
Based on pivot point analysis, here are the key levels to watch:
Pivot Point (PP): ₹16,163.67
Resistance Levels: ₹16,416.33 (R1), ₹16,567.67 (R2), ₹16,820.33 (R3)
Support Levels: ₹16,012.33 (S1), ₹15,759.67 (S2), ₹15,608.33 (S3)
These levels are derived from standard pivot point calculations and can serve as potential entry or exit points for traders.
Technical Indicators
Relative Strength Index (RSI): Currently at 59.15, indicating that the stock is not yet overbought and may have room for further upside.
Moving Averages: The stock is trading above its 50-day and 200-day moving averages, confirming an uptrend.
MACD: The Moving Average Convergence Divergence (MACD) is positive, suggesting bullish momentum.
관련 발행물
면책사항
해당 정보와 게시물은 금융, 투자, 트레이딩 또는 기타 유형의 조언이나 권장 사항으로 간주되지 않으며, 트레이딩뷰에서 제공하거나 보증하는 것이 아닙니다. 자세한 내용은 이용 약관을 참조하세요.
관련 발행물
면책사항
해당 정보와 게시물은 금융, 투자, 트레이딩 또는 기타 유형의 조언이나 권장 사항으로 간주되지 않으며, 트레이딩뷰에서 제공하거나 보증하는 것이 아닙니다. 자세한 내용은 이용 약관을 참조하세요.