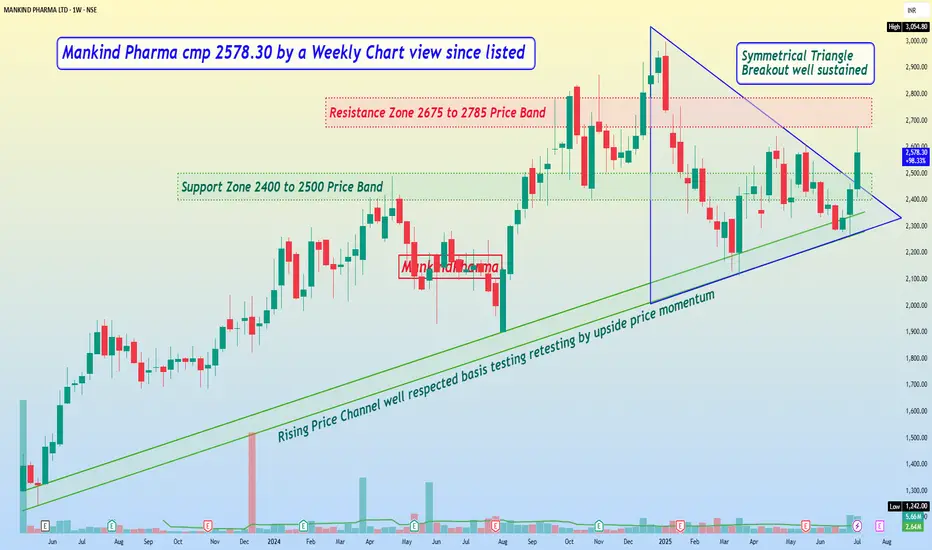
Mankind Pharma cmp 2578.30 by a Weekly Chart view since listed
- Support Zone 2400 to 2500 Price Band
- Resistance Zone 2675 to 2785 Price Band
- Symmetrical Triangle Breakout well sustained
- Back to back Bullish Rounding Bottom with Resistance Zone neckline
- Most common Technical Indicators BB, EMA, SAR, MACD, RSI turning positive
- Good Volumes increase, well above avg traded quantity by demand based buying
- Rising Price Channel well respected basis testing retesting by upside price momentum
면책사항
이 정보와 게시물은 TradingView에서 제공하거나 보증하는 금융, 투자, 거래 또는 기타 유형의 조언이나 권고 사항을 의미하거나 구성하지 않습니다. 자세한 내용은 이용 약관을 참고하세요.
면책사항
이 정보와 게시물은 TradingView에서 제공하거나 보증하는 금융, 투자, 거래 또는 기타 유형의 조언이나 권고 사항을 의미하거나 구성하지 않습니다. 자세한 내용은 이용 약관을 참고하세요.