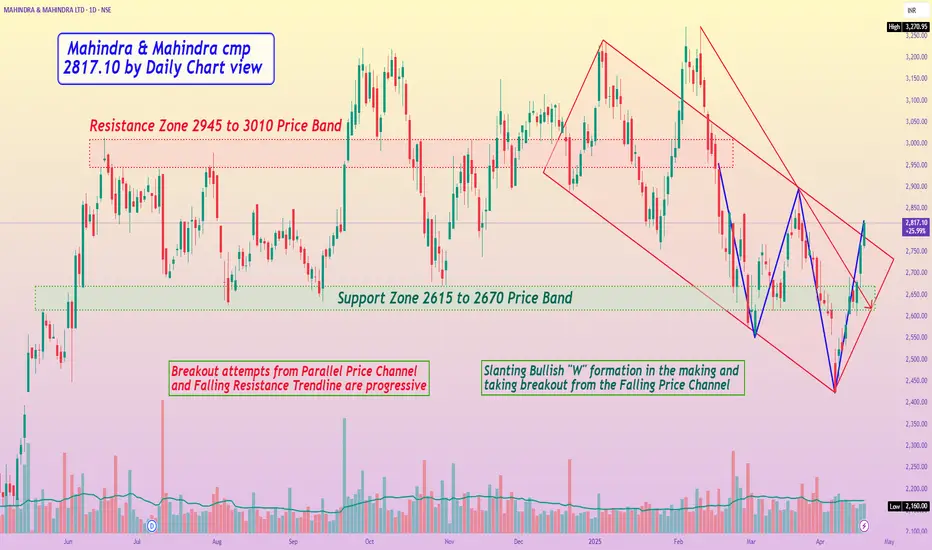
Mahindra & Mahindra cmp 2817.10 by Daily Chart view
- Support Zone 2615 to 2670 Price Band
- Resistance Zone 2945 to 3010 Price Band
- Volumes are seen to be getting in close sync with the average traded quantity
- Breakout attempts from Parallel Price Channel and Falling Resistance Trendline are progressive
- Slanting Bullish "W" formation in the making and taking breakout from the Falling Price Channel
면책사항
이 정보와 게시물은 TradingView에서 제공하거나 보증하는 금융, 투자, 거래 또는 기타 유형의 조언이나 권고 사항을 의미하거나 구성하지 않습니다. 자세한 내용은 이용 약관을 참고하세요.
면책사항
이 정보와 게시물은 TradingView에서 제공하거나 보증하는 금융, 투자, 거래 또는 기타 유형의 조언이나 권고 사항을 의미하거나 구성하지 않습니다. 자세한 내용은 이용 약관을 참고하세요.