## 📊 **LTTS Daily Chart Analysis**
### 🧩 **Price Structure Overview**
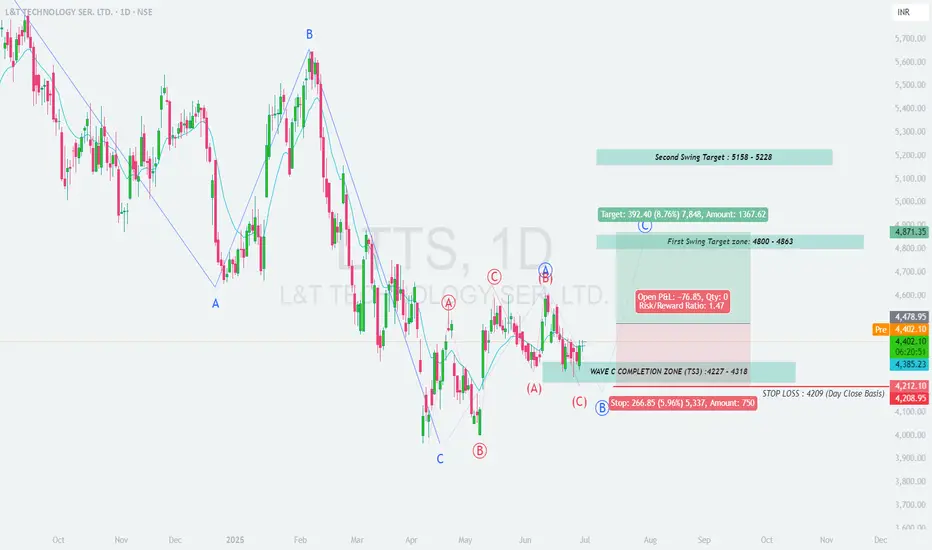
* The chart shows a completed **ABC correction** pattern.
* Price has recently bounced from a key \support demand zone\, marked by the blue and yellow boxes.
* A bullish wave structure is potentially forming, indicating trend reversal.
---
## 📉 **Support Zones**
* 📌 \Primary Support Zone:\ ₹4280–₹4320 (yellow box)
* 📌 \Structure Support (TS3 \[W3]):\ \~₹4225
Price recently reacted from these support areas with higher lows, hinting at buying interest and strength building.
---
## 📈 **Immediate Resistance / Supply Zones**
* 🟨 \Minor Resistance Zone:\ ₹4620–₹4700 (yellow box)
* 🟦 \Primary Resistance Zone / Target 1:\ ₹4800–₹4863
* 🟩 \Extended Upside Target Zone:\ ₹5450–₹5650 (green box)
---
## 📝 **Trade Idea: Positional Long**
### ✅ \Entry:\
* Around CMP (₹4405) or on dips towards ₹4300–₹4320 with bullish confirmation.
### 🎯 \Targets:\
* \T1:\ ₹4620
* \T2:\ ₹4800–₹4863
* \T3 (Extended):\ ₹5450–₹5650 (if trend sustains)
### ❌ \Stop Loss:\
* Daily close below \₹4225\ (below TS3 low)
---
## 🧠 **Trade Logic & Strategy**
* Price has respected the support zones and formed a possible reversal structure.
* If the stock breaks above the ₹4620–₹4700 zone, it can accelerate toward the ₹4800+ levels.
* Conservative traders can enter after a daily close above ₹4620.
---
## 📌 **Conclusion**
LTTS is setting up for a potential **bullish swing move**.
A structure-based entry near support with defined SL offers a favorable **risk-to-reward** setup for positional traders.
면책사항
이 정보와 게시물은 TradingView에서 제공하거나 보증하는 금융, 투자, 거래 또는 기타 유형의 조언이나 권고 사항을 의미하거나 구성하지 않습니다. 자세한 내용은 이용 약관을 참고하세요.
면책사항
이 정보와 게시물은 TradingView에서 제공하거나 보증하는 금융, 투자, 거래 또는 기타 유형의 조언이나 권고 사항을 의미하거나 구성하지 않습니다. 자세한 내용은 이용 약관을 참고하세요.