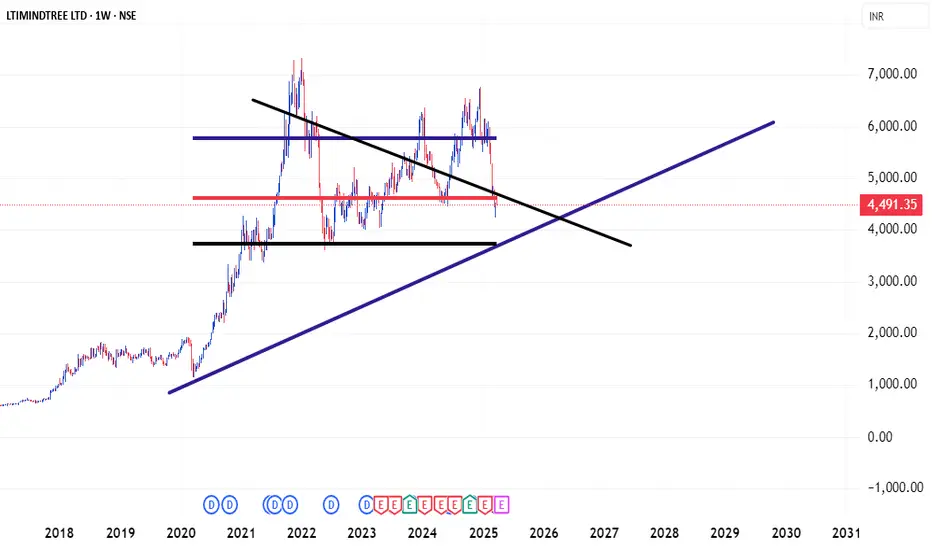
LTIM On Volume Profile And How To Use In Trading & Investing Journey
Volume Profile is a **technical analysis tool** that shows the **traded volume** of an asset at different price levels over a specific period. Unlike traditional volume indicators (which display volume over time), Volume Profile helps traders understand **where the most buying and selling activity occurred at different price levels**.
### **Key Components of Volume Profile:**
1. **Point of Control (POC):**
- The price level where the highest volume of trades occurred.
- Acts as a strong support or resistance level.
2. **Value Area (VA):**
- The price range where **70% of the total volume** was traded.
- Consists of:
- **Value Area High (VAH):** Upper boundary of the value area (resistance).
- **Value Area Low (VAL):** Lower boundary of the value area (support).
3. **High Volume Nodes (HVN):**
- Areas with high trading activity.
- Indicates strong interest and potential price stability.
4. **Low Volume Nodes (LVN):**
- Areas with little trading activity.
- Suggests price levels where the market moved quickly without much consolidation.
### **Why Use Volume Profile?**
- **Identifies strong support and resistance levels.**
- **Finds areas of high liquidity (POC) where price tends to consolidate.**
- **Spot breakouts and reversals by analyzing volume distribution.**
- **Helps traders make informed entry and exit decisions.**
### **How to Use Volume Profile in Trading?**
1. **Trend Confirmation:** If price moves above the POC with strong volume, it suggests an uptrend. If it moves below, a downtrend.
2. **Breakout Trading:** A breakout above VAH or below VAL with strong volume can indicate trend continuation.
3. **Reversal Signals:** If price moves to LVN, it might reverse as there is low liquidity in that zone.
면책사항
이 정보와 게시물은 TradingView에서 제공하거나 보증하는 금융, 투자, 거래 또는 기타 유형의 조언이나 권고 사항을 의미하거나 구성하지 않습니다. 자세한 내용은 이용 약관을 참고하세요.
면책사항
이 정보와 게시물은 TradingView에서 제공하거나 보증하는 금융, 투자, 거래 또는 기타 유형의 조언이나 권고 사항을 의미하거나 구성하지 않습니다. 자세한 내용은 이용 약관을 참고하세요.
