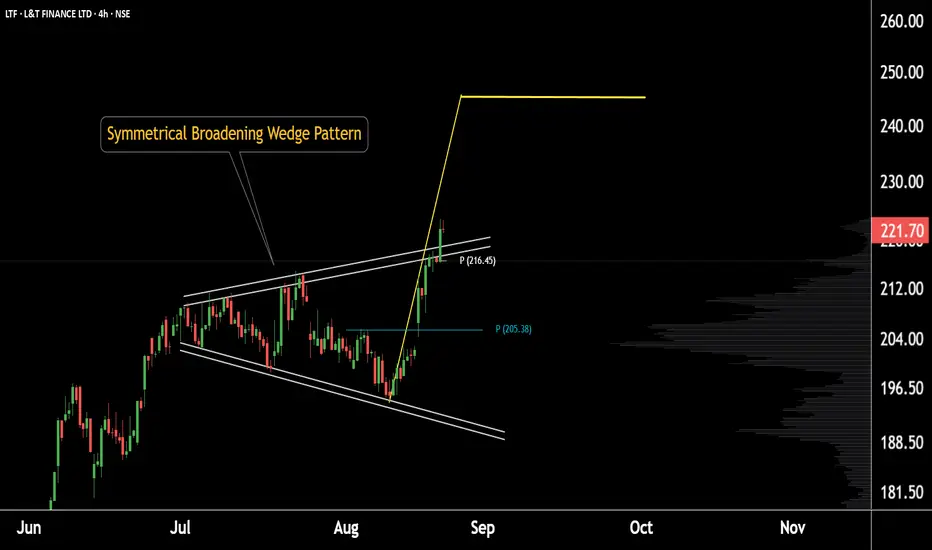
This is the daily chart of L&T Finance.
The stock has been forming a broadening wedge pattern and has recently given a pattern breakout around 220.
Currently, L&T Finance is sustaining above its daily pivot level of 216, with strong support in the 215–220 zone.
If this support holds, we may witness higher prices in the stock.
Thank you.
The stock has been forming a broadening wedge pattern and has recently given a pattern breakout around 220.
Currently, L&T Finance is sustaining above its daily pivot level of 216, with strong support in the 215–220 zone.
If this support holds, we may witness higher prices in the stock.
Thank you.
@RahulSaraoge
Connect us at t.me/stridesadvisory
Connect us at t.me/stridesadvisory
면책사항
해당 정보와 게시물은 금융, 투자, 트레이딩 또는 기타 유형의 조언이나 권장 사항으로 간주되지 않으며, 트레이딩뷰에서 제공하거나 보증하는 것이 아닙니다. 자세한 내용은 이용 약관을 참조하세요.
@RahulSaraoge
Connect us at t.me/stridesadvisory
Connect us at t.me/stridesadvisory
면책사항
해당 정보와 게시물은 금융, 투자, 트레이딩 또는 기타 유형의 조언이나 권장 사항으로 간주되지 않으며, 트레이딩뷰에서 제공하거나 보증하는 것이 아닙니다. 자세한 내용은 이용 약관을 참조하세요.