📊 Intraday Support and Resistance Levels
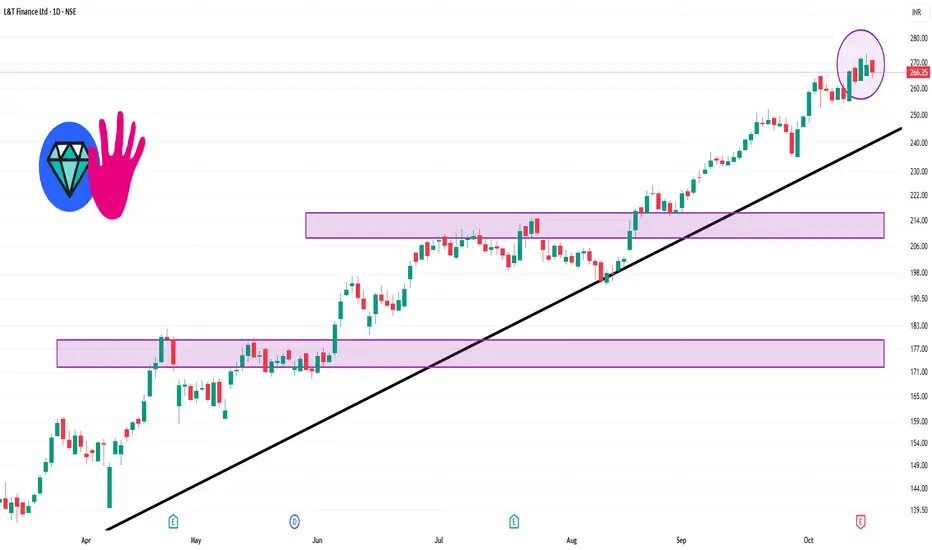
Immediate Support: ₹263.19
First Resistance: ₹270.14
Second Resistance: ₹274.02
Third Resistance: ₹277.09
These levels are derived from pivot point calculations and are commonly used by traders to identify potential entry and exit points.
📈 Technical Indicators
Relative Strength Index (RSI): 63.91, indicating that the stock is approaching overbought territory.
Money Flow Index (MFI): 78.20, suggesting strong buying interest.
MACD: The MACD line is at 9.28, with the signal line at 9.06, showing a bullish crossover.
Average True Range (ATR): ₹7.16, reflecting moderate volatility.
Average Directional Index (ADX): 38.39, indicating a strong trend.
관련 발행물
면책사항
해당 정보와 게시물은 금융, 투자, 트레이딩 또는 기타 유형의 조언이나 권장 사항으로 간주되지 않으며, 트레이딩뷰에서 제공하거나 보증하는 것이 아닙니다. 자세한 내용은 이용 약관을 참조하세요.
관련 발행물
면책사항
해당 정보와 게시물은 금융, 투자, 트레이딩 또는 기타 유형의 조언이나 권장 사항으로 간주되지 않으며, 트레이딩뷰에서 제공하거나 보증하는 것이 아닙니다. 자세한 내용은 이용 약관을 참조하세요.