The chart of L&T Finance tells a neat Elliott Wave story through channels and Fibonacci.
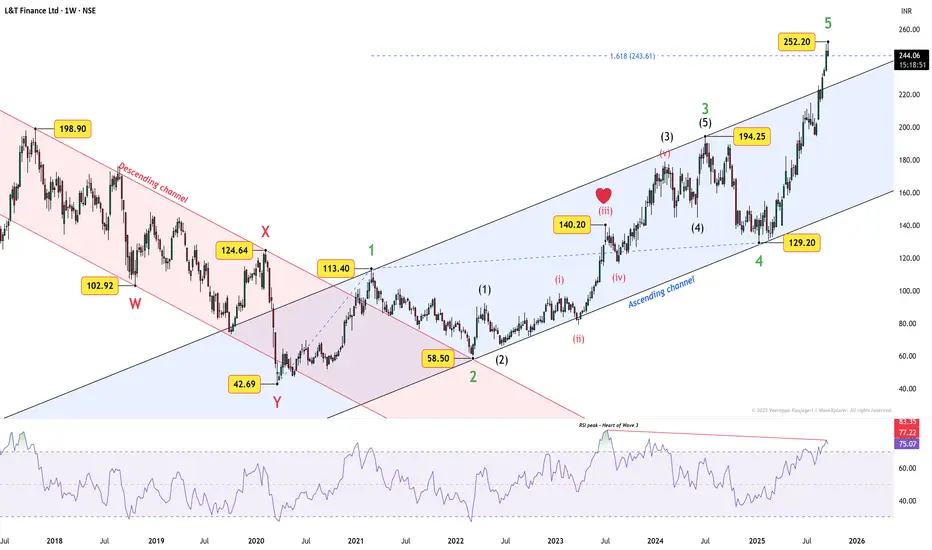
First, notice the two channels. The old descending channel captured the corrective W-X-Y down to ₹42.69. From there, price shifted into an ascending channel.
Look how cleanly price respected this structure:
Within Wave 3, the strongest push came at ₹140.20 — the famous heart of Wave 3 (what traders call the 3-of-3-of-3). RSI also peaked there, confirming it as the most powerful thrust of the sequence.
Now, price has surged into Green Wave 5, reaching ₹252.20, which is already above the 1.618 Fibonacci extension. It could extend higher, but RSI is diverging — momentum is not confirming the new highs.
That makes me cautious. While my view is leaning bearish, I don’t want to chase the upside here. Confirmation will come only if price falls back inside the ascending channel. Once that happens, I’ll update bearish targets based on fresh price action.
For now, the chart has delivered a textbook lesson: two channels, a Fibonacci story, and the heart of Wave 3 flashing exactly where it should.
Disclaimer: This analysis is for educational purposes only and does not constitute investment advice. Please do your own research (DYOR) before making any trading decisions.
First, notice the two channels. The old descending channel captured the corrective W-X-Y down to ₹42.69. From there, price shifted into an ascending channel.
Look how cleanly price respected this structure:
- Green Wave 1 kissed the upper line of the ascending channel.
- Green Wave 2 bottomed at ₹58.50 — right at the intersection of both channels.
- Green Wave 3 again touched the channel’s upper line, marking its high with precision.
- Green Wave 4 rested at the lower line of the channel.
Within Wave 3, the strongest push came at ₹140.20 — the famous heart of Wave 3 (what traders call the 3-of-3-of-3). RSI also peaked there, confirming it as the most powerful thrust of the sequence.
Now, price has surged into Green Wave 5, reaching ₹252.20, which is already above the 1.618 Fibonacci extension. It could extend higher, but RSI is diverging — momentum is not confirming the new highs.
That makes me cautious. While my view is leaning bearish, I don’t want to chase the upside here. Confirmation will come only if price falls back inside the ascending channel. Once that happens, I’ll update bearish targets based on fresh price action.
For now, the chart has delivered a textbook lesson: two channels, a Fibonacci story, and the heart of Wave 3 flashing exactly where it should.
Disclaimer: This analysis is for educational purposes only and does not constitute investment advice. Please do your own research (DYOR) before making any trading decisions.
WaveXplorer | Elliott Wave insights
📊 X profile: @veerappa89
📊 X profile: @veerappa89
면책사항
해당 정보와 게시물은 금융, 투자, 트레이딩 또는 기타 유형의 조언이나 권장 사항으로 간주되지 않으며, 트레이딩뷰에서 제공하거나 보증하는 것이 아닙니다. 자세한 내용은 이용 약관을 참조하세요.
WaveXplorer | Elliott Wave insights
📊 X profile: @veerappa89
📊 X profile: @veerappa89
면책사항
해당 정보와 게시물은 금융, 투자, 트레이딩 또는 기타 유형의 조언이나 권장 사항으로 간주되지 않으며, 트레이딩뷰에서 제공하거나 보증하는 것이 아닙니다. 자세한 내용은 이용 약관을 참조하세요.