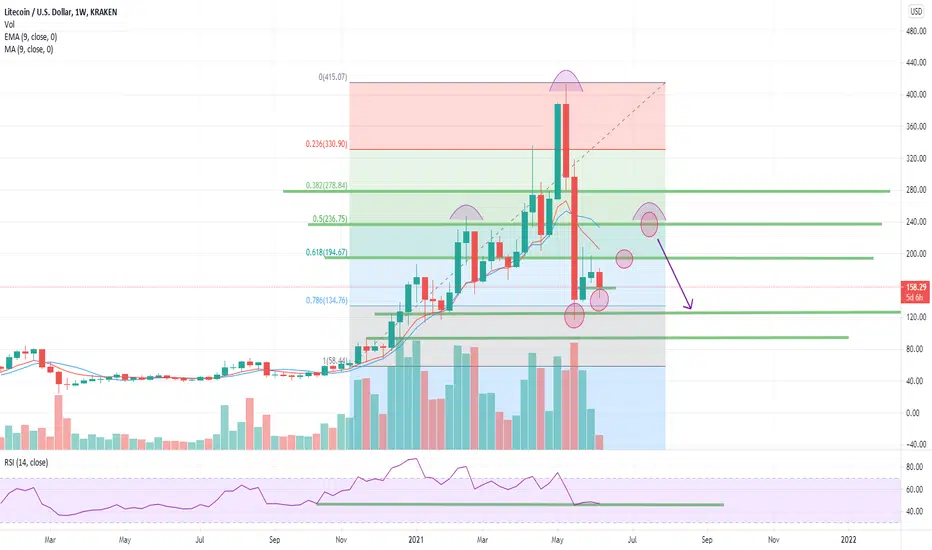
We continued to the downside, contrary to what I was expecting. So now we are looking at the weekly chart.
This is just another iteration of my previous ideas. This time, you can see the levels of resistance and support align with the fib levels. This retracement has gone deep into the gains of the last impulse. The Chart shows a potential for continued higher lows. The rsi is at 47 at time of post. If the shoulder is completed, I see a potential short opportunity coming.
This is not financial advice. This is for my reference and record as a hobby trader.
Related ideas linked.
관련 발행물
면책사항
해당 정보와 게시물은 금융, 투자, 트레이딩 또는 기타 유형의 조언이나 권장 사항으로 간주되지 않으며, 트레이딩뷰에서 제공하거나 보증하는 것이 아닙니다. 자세한 내용은 이용 약관을 참조하세요.
면책사항
해당 정보와 게시물은 금융, 투자, 트레이딩 또는 기타 유형의 조언이나 권장 사항으로 간주되지 않으며, 트레이딩뷰에서 제공하거나 보증하는 것이 아닙니다. 자세한 내용은 이용 약관을 참조하세요.