Here's the **technical analysis** of **Lloyds Enterprises Ltd (NSE: LLOYDSENT)** on the **daily chart**,
---
## 📊 **Lloyds Enterprises Ltd – Daily Chart Analysis**
---
### 🧩 **Chart Patterns Observed**
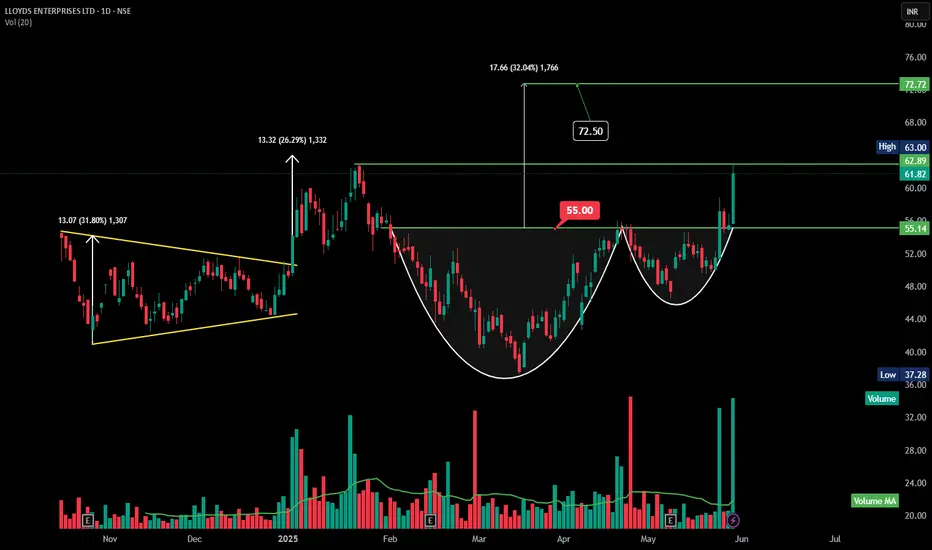
#### 2. **Cup and Handle Formation**
* A well-formed **cup and handle** pattern observed between March–May 2025.
* **Neckline breakout**: ₹55.00
* The price surged sharply after breakout, confirming pattern validity.
---
### 📏 **Price Action & Measured Targets**
| Move Type | Range | Target |
| --------------------- | ---------------------- | --------------------------------- |
| Cup & Handle Breakout | ₹55.00 → ₹72.50 | **₹72.50** (Measured Move Target) |
| Current Price | ₹61.82 | |
| Immediate Resistance | ₹63.00 | |
| Support | ₹55.14 (Breakout zone) | |
* Breakout move from ₹55 to ₹63 already achieved \~14.5% rally.
* **Next target**: ₹72.50 (as per the height of the cup added to breakout zone).
---
### 🔥 **Volume Analysis**
* Massive **volume spike** on breakout candle above ₹55.00 — signifies **strong buying interest**, likely institutional participation.
* Previous volume bars were average or decreasing → confirms **handle was low-volume** (ideal setup).
---
### 🧭 **Key Technical Levels**
| Level Type | Price (₹) |
| ------------------------ | --------------- |
| Resistance 1 (immediate) | ₹63.00 |
| Target Zone | ₹72.50 – ₹72.72 |
| Breakout Zone (Support) | ₹55.00–₹55.14 |
| Strong Support | ₹48.00 |
---
### ✅ **Technical Conclusion**
📌 **Bias**: **Strongly Bullish**
* Price broke above both **cup neckline** and **horizontal resistance** with confirmation.
* RSI likely to be nearing overbought; hence, a short pause/consolidation can occur around ₹63 before next leg up.
---
### 🎯 **Trading Strategy**
| Strategy | Plan |
| ----------------------- | ------------------------------------------------------- |
| **Swing Buy on Retest** | Enter on dip near ₹58–₹60 zone |
| **Target** | ₹72.50–₹72.72 |
| **Stop Loss** | Below ₹54.80 (close basis) |
| **Momentum Play** | Add above ₹63 on closing basis with volume confirmation |
🧠 Risk-Reward looks favorable (\~1:2+) for swing traders.
---
## 📊 **Lloyds Enterprises Ltd – Daily Chart Analysis**
---
### 🧩 **Chart Patterns Observed**
#### 2. **Cup and Handle Formation**
* A well-formed **cup and handle** pattern observed between March–May 2025.
* **Neckline breakout**: ₹55.00
* The price surged sharply after breakout, confirming pattern validity.
---
### 📏 **Price Action & Measured Targets**
| Move Type | Range | Target |
| --------------------- | ---------------------- | --------------------------------- |
| Cup & Handle Breakout | ₹55.00 → ₹72.50 | **₹72.50** (Measured Move Target) |
| Current Price | ₹61.82 | |
| Immediate Resistance | ₹63.00 | |
| Support | ₹55.14 (Breakout zone) | |
* Breakout move from ₹55 to ₹63 already achieved \~14.5% rally.
* **Next target**: ₹72.50 (as per the height of the cup added to breakout zone).
---
### 🔥 **Volume Analysis**
* Massive **volume spike** on breakout candle above ₹55.00 — signifies **strong buying interest**, likely institutional participation.
* Previous volume bars were average or decreasing → confirms **handle was low-volume** (ideal setup).
---
### 🧭 **Key Technical Levels**
| Level Type | Price (₹) |
| ------------------------ | --------------- |
| Resistance 1 (immediate) | ₹63.00 |
| Target Zone | ₹72.50 – ₹72.72 |
| Breakout Zone (Support) | ₹55.00–₹55.14 |
| Strong Support | ₹48.00 |
---
### ✅ **Technical Conclusion**
📌 **Bias**: **Strongly Bullish**
* Price broke above both **cup neckline** and **horizontal resistance** with confirmation.
* RSI likely to be nearing overbought; hence, a short pause/consolidation can occur around ₹63 before next leg up.
---
### 🎯 **Trading Strategy**
| Strategy | Plan |
| ----------------------- | ------------------------------------------------------- |
| **Swing Buy on Retest** | Enter on dip near ₹58–₹60 zone |
| **Target** | ₹72.50–₹72.72 |
| **Stop Loss** | Below ₹54.80 (close basis) |
| **Momentum Play** | Add above ₹63 on closing basis with volume confirmation |
🧠 Risk-Reward looks favorable (\~1:2+) for swing traders.
면책사항
해당 정보와 게시물은 금융, 투자, 트레이딩 또는 기타 유형의 조언이나 권장 사항으로 간주되지 않으며, 트레이딩뷰에서 제공하거나 보증하는 것이 아닙니다. 자세한 내용은 이용 약관을 참조하세요.
면책사항
해당 정보와 게시물은 금융, 투자, 트레이딩 또는 기타 유형의 조언이나 권장 사항으로 간주되지 않으며, 트레이딩뷰에서 제공하거나 보증하는 것이 아닙니다. 자세한 내용은 이용 약관을 참조하세요.