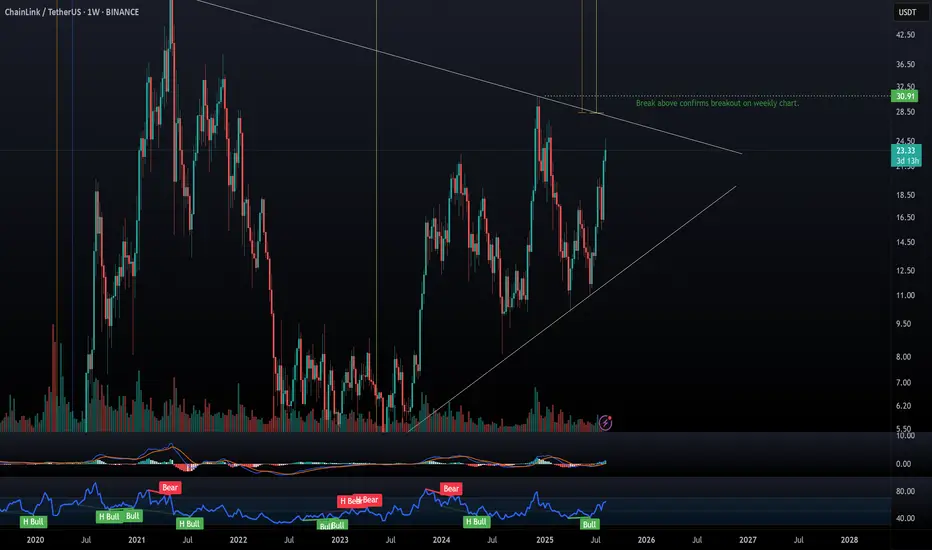
A huge bullflag pattern has formed on the weekly chart, if this breaks to the upside we could be looking a face melting targets, with the most bullish targets exceeding $1000.
I've added horizontal ray lines with highlighted price targets to the left, colour coded to the corresponding price range. Once the price breaks out of the triangle, I've also added a confirmed breakout level, which is the previous resistance line touch point.
Hopefully this plays out and we'll all buying yachts :)
I'm not a financial advisor and my posts are not financial advice and should not be taken as financial advice. They're only my interpretation based on my own research and should only be used for educational and entertainment purposes.
Born Of Crypto :)
Born Of Crypto :)
면책사항
해당 정보와 게시물은 금융, 투자, 트레이딩 또는 기타 유형의 조언이나 권장 사항으로 간주되지 않으며, 트레이딩뷰에서 제공하거나 보증하는 것이 아닙니다. 자세한 내용은 이용 약관을 참조하세요.