According to Mr. Elder's method, I start my analysis with the senior chart, for me it's the Weekly. I look through the list of stocks looking for stocks with a price divergence to the MACD indicator. This is my "first Elder screen"

After that, I switch to the daily chart and look at the selected stocks on this time frame. This is my "second Elder screen"

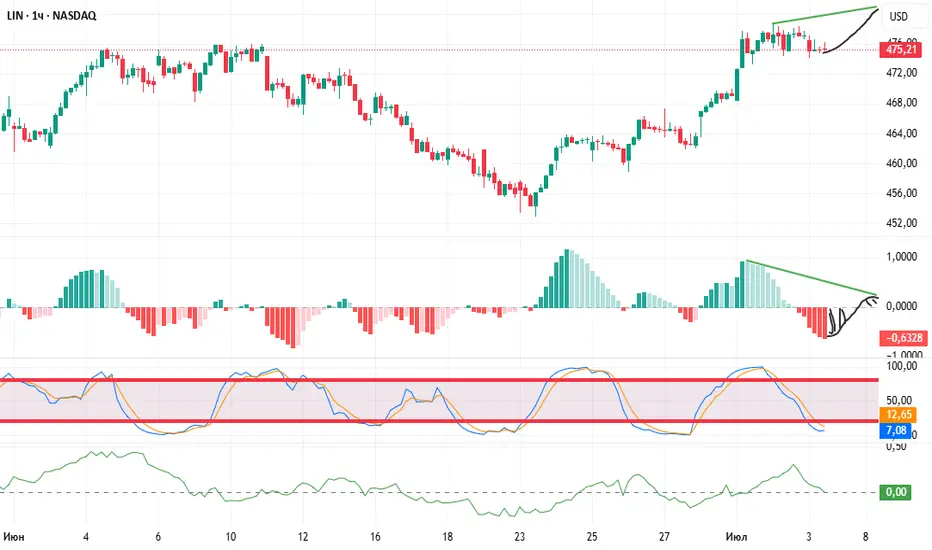
And I do the same procedure with the selected charts on the hourly chart

This stock has not yet generated a signal on the hourly chart, but I have set an alert for a break of the previous top, and when it is broken, I would like to see a divergence of price to the MACD indicator. Then I will enter the trade.
After that, I switch to the daily chart and look at the selected stocks on this time frame. This is my "second Elder screen"
And I do the same procedure with the selected charts on the hourly chart
This stock has not yet generated a signal on the hourly chart, but I have set an alert for a break of the previous top, and when it is broken, I would like to see a divergence of price to the MACD indicator. Then I will enter the trade.
면책사항
이 정보와 게시물은 TradingView에서 제공하거나 보증하는 금융, 투자, 거래 또는 기타 유형의 조언이나 권고 사항을 의미하거나 구성하지 않습니다. 자세한 내용은 이용 약관을 참고하세요.
면책사항
이 정보와 게시물은 TradingView에서 제공하거나 보증하는 금융, 투자, 거래 또는 기타 유형의 조언이나 권고 사항을 의미하거나 구성하지 않습니다. 자세한 내용은 이용 약관을 참고하세요.